


 105 128

0
10
20
30
40
50
60
70
#1 #2 #1 #2
#1 #2 #1 #2
#1 #2 #1 #2
#1 #2 #1 #2
0
5
10
15
20
25
30
35
40
45
50
#1 #2 #1 #2
#1 #2 #1 #2
#1 #2 #1 #2
#1 #2 #1 #2
C
Annexin V
7AAD
% of Annexin V
+
cells
in INS-GFP
+
cells
D
A
palm ctrl-p glu ctrl-g
wt-#1
wt-#2
CDKAL1
-/-
-#1
CDKAL1
-/-
-#2
B
n.s
% of PI
+
INS
+
cells
in INS
+
cells
ctrl-g glu ctrl-p palm
PI
insulin
DAPI
wt
wt-#1
CDKAL1
-/-
-
#1
wt-#1
CDKAL1
-/-
-#1
ctrl-p
palm
E
F
palm ctrl-p glu ctrl-g
22.2 22.9 22.8 20.9
42.2 42.0 60.4 57.9
n.s
****
****
n.s
ctrl-g glu ctrl-p palm
wt
CDKAL1
-/-
n.s
**
***
19.9 19.3 20.1 19.3
38.0 39.5 53.2 52.7
CDKAL1
-/-
wt-#1
wt-#2
CDKAL1
-/-
-#1
CDKAL1
-/-
-#2
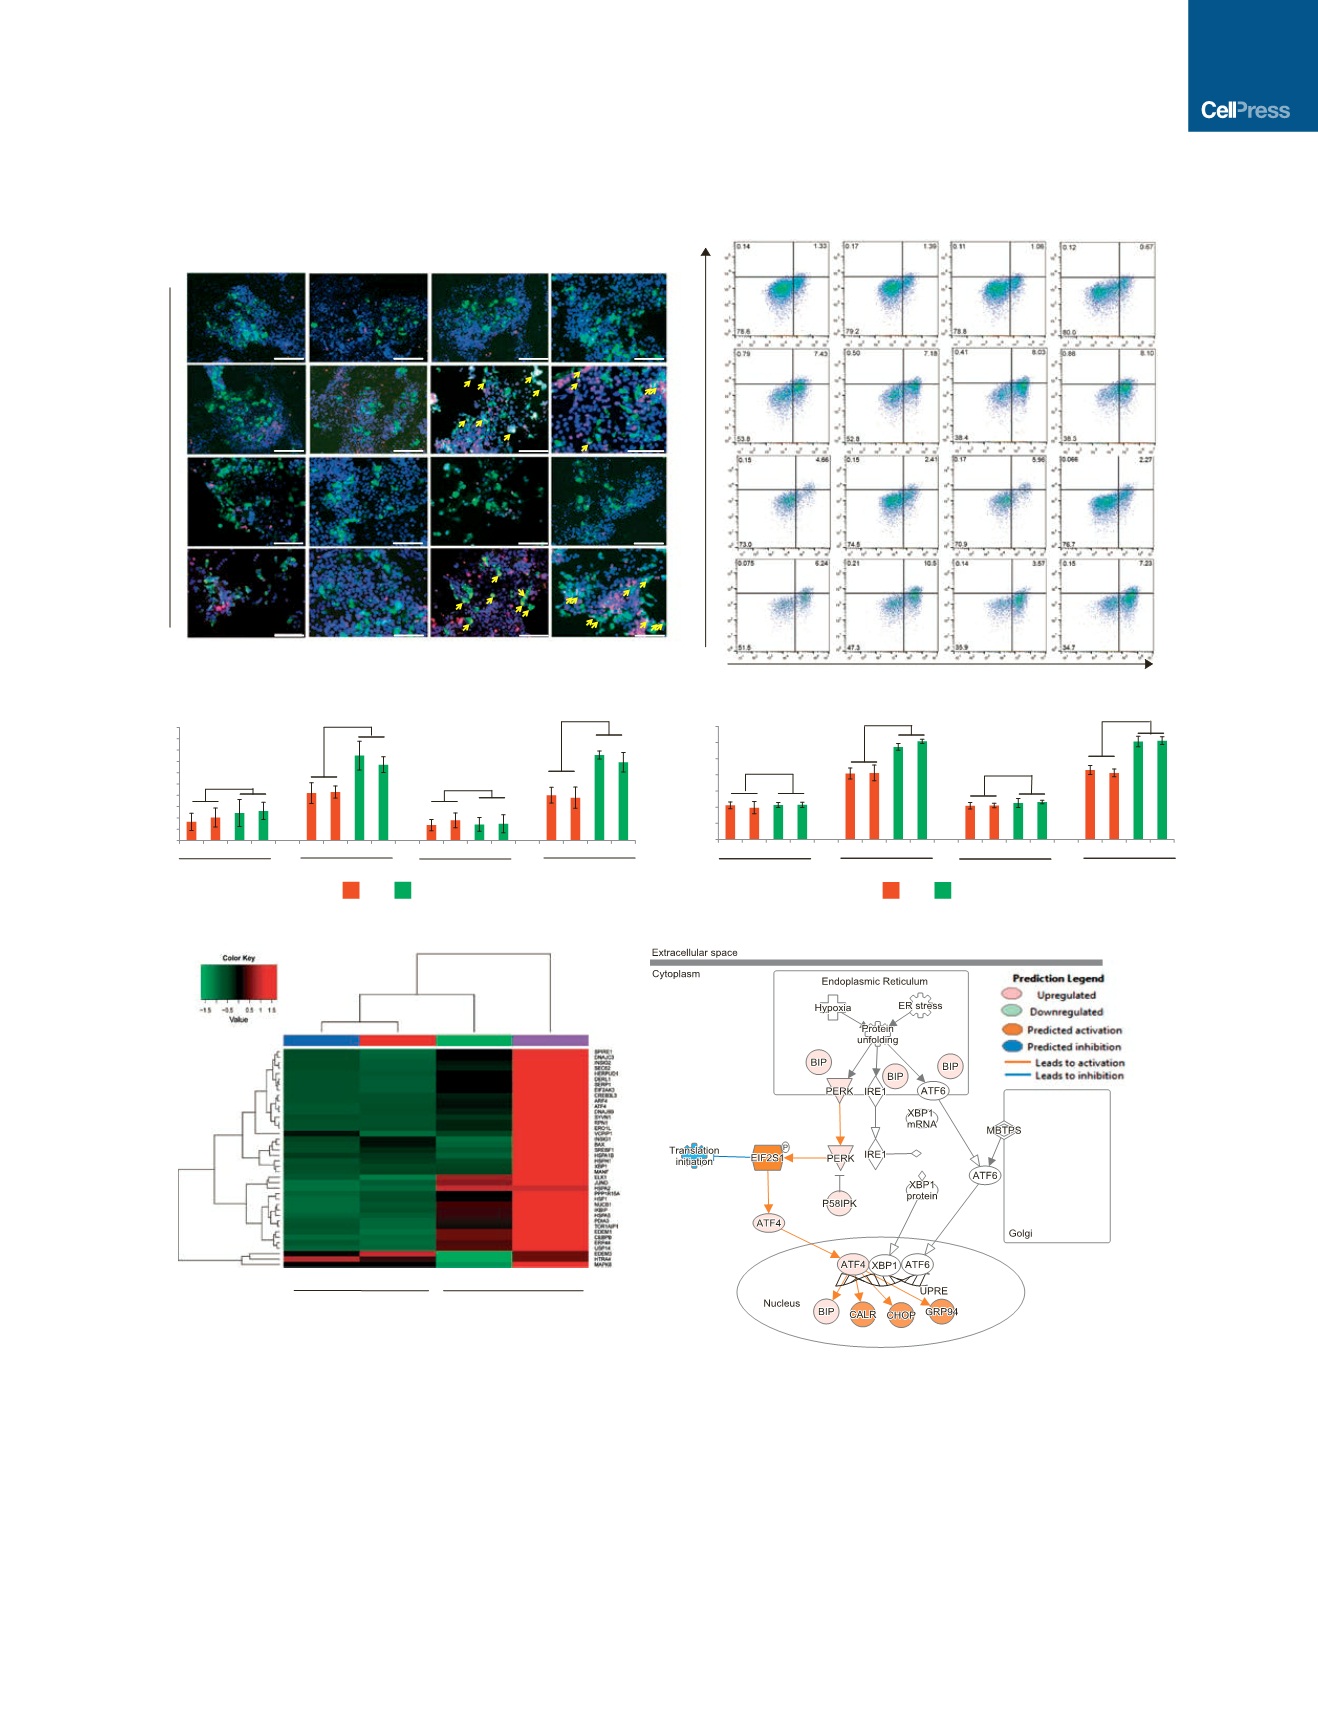
Figure 3.
CDKAL1
–/–
Insulin-GFP
+
Cells Are Hypersensitive to Glucotoxicity and Lipotoxicity
(A and B) Immunocytochemistry analysis (A) and quantification of the percentage (B) of PI
+
/insulin
+
cells in wt or
CDKAL1
/
insulin
+
cells cultured in the presence
of 2 mM D-glucose (ctrl-g), 35 mM D-glucose (glu), no palmitate (ctrl-p), or 1 mM palmitate (palm). PI
+
/insulin
+
cells are highlighted by arrows.
(C and D) Flow cytometry analysis (C) and quantification of the percentage (D) of annexin V
+
cells in wt and
CDKAL1
/
insulin-GFP
+
cells cultured as in (A).
(E) Heatmap representing the expression profiles of ER-stress-related genes comparing wt and
CDKAL1
/
insulin
+
cells cultured in the absence or presence of
1 mM palmitate.
(F) Ingenuity pathway analysis of genes that are >2-fold upregulated in
CDKAL1
/
insulin
+
cells cultured in the presence of 1 mM palmitate.
INS, insulin; PI, propidium iodide. n = 3 independent biological replicates. n.s. indicates a non-significant difference. Clones no. 1 and no. 2 are two independent
isogenic hESC clones carrying different frameshift mutations. hESCs were differentiated using protocol 2. p values calculated by unpaired two-tailed Student’s
t test were *p < 0.05, **p < 0.01, ***p < 0.001, and ****p < 0.0001. The scale bar represents 100
m
m. See also Figure S3.
Cell Stem Cell
19
, 326–340, September 1, 2016
331