


 111 128

0
50
100
150
200
250
300
350
400
0
50
100
150
200
250
300
350
400
0
100
200
300
400
500
600
0
100
200
300
400
500
600
Blood Glucose (mg/dL)
0
5000
10000
15000
20000
25000
30000
35000
40000
45000
0
100
200
300
400
500
600
700
0 15 30 45 60 75 90 105 120
scramble
sgRNA
sgFOS
0
100
200
300
400
500
600
700
800
0 15 30 45 60 75 90 105 120
vehicle
T5224
0
10000
20000
30000
40000
50000
60000
70000
C
*
Time (min)
Blood Glucose (mg/dL)
**
n.s.
wt
CDKAL1
-/-
A
Human insulin (pg/mL)
B
fasting
after
glucose
D
Human insulin (pg/mL)
*
n.s.
vehicle T5224
fasting
after
glucose
*
*
**
AUC
Human insulin (pg/mL)
**
n.s.
fasting
after
glucose
scramble sgFOS
sgRNA
H
vehicle T5224
I
Time (min)
J
AUC
scramble sgFOS
sgRNA
*
*
*
E
F
G
Human insulin (pg/mL)
*
n.s.
vehicle T5224
fasting
after
glucose
0
100
200
300
400
500
600
700
0 15 30 45 60 75 90 105 120
vehicle
T5224
0
5000
10000
15000
20000
25000
30000
35000
40000
45000
50000
vehicle T5224
***
Blood Glucose (mg/dL)
AUC
*
*
*
Time (min)
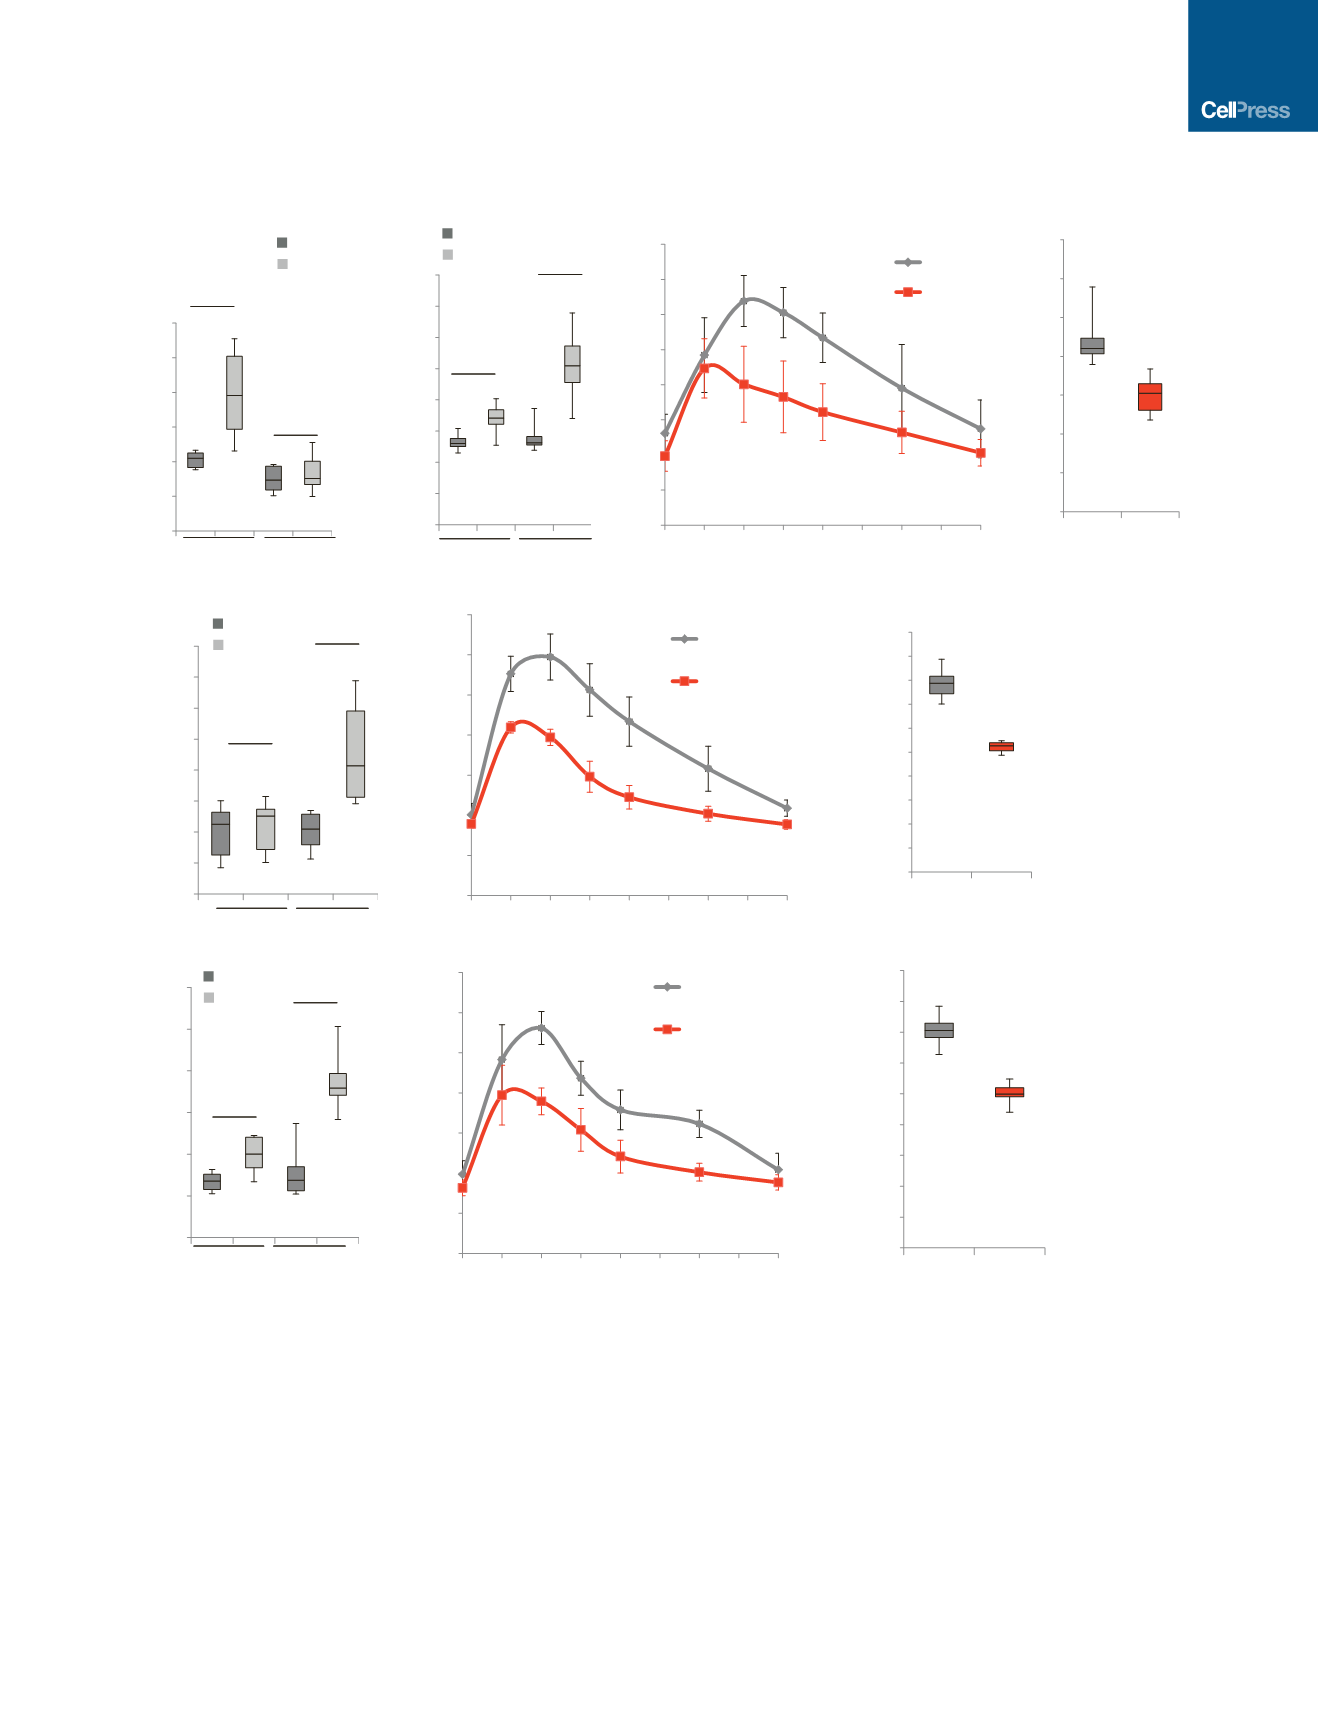
Figure 7. T5224 or Loss of
FOS
Rescues the Function of
CDKAL1
–/–
Cells in SCID-Beige Mice Carrying Human Cells
(A) Human insulin GSIS at 10 weeks after transplantation of mutant cells compared to wt cells.
(B) GSIS secretion of SCID-beige mice carrying human cells after glucose stimulation 48 hr after treatment with 300 mg/kg T5224 or vehicle.
(C and D) IPGTT (C) and AUC (D) of mice transplanted with
CDKAL1
/
cells treated with 300 mg/kg T5224 or vehicle.
(E) GSIS secretion of SCID-beige mice carrying human cells after glucose stimulation after treatment with T5224 or vehicle twice a week for 4 weeks.
(F and G) IPGTT (F) and AUC (G) of mice transplanted with
CDKAL1
/
cells treated with 300 mg/kg T5224 or vehicle twice a week for 4 weeks.
(H) GSIS secretion of SCID-beige mice transplanted with
CDKAL1
/
cells carrying scramble sgRNA or
CDKAL1
/
cells carrying sgFOS.
(I and J) IPGTT (I) and AUC (J) of mice transplanted with
CDKAL1
/
cells carrying scramble sgRNA or
CDKAL1
/
cells carrying sgFOS at 6 weeks after
transplantation.
n = 8 mice for each condition. hESCs were differentiated using protocol 2. In GSIS assay, p values were calculated by one-way repeated-measures ANOVA. In
IPGTT assay, p values were calculated by two-way repeated-measures ANOVA with a Bonferroni test for multiple comparisons between DMSO and T5224
treated conditions. p values were *p < 0.05, **p < 0.01, and ***p < 0.001. See also Figure S7.
Cell Stem Cell
19
, 326–340, September 1, 2016
337