


 117 128

efficiency. While we were able to readily reprogram del(7q)-
MDS cells, as we have previously reported (Kotini et al.,
2015), we were not able to reprogram cells from patients with
del(5q)-MDS or monosomy 7 (patients 5–8; Table S1). After at
least two attempts for each patient and using different aliquots
of starting cells, we were only able to derive either no iPSC lines
(patient 5) or only normal iPSC lines, even though normal cells
comprised only a minority of the starting population. Since in
other reprogramming experiments MDS or AML cells did not
have a general reprogramming disadvantage over normal cells
(patients 1, 3, and 4; Table S1), this bias is most likely deter-
mined by the specific genetic composition of the malignant
clone in each patient. In agreement with this, reprogramming
of patient 2 cells, in more than one independent reprogramming
experiment, gave consistently more normal than MDS iPSCs
(only 2 out of 17 iPSC lines were derived from the MDS cells,
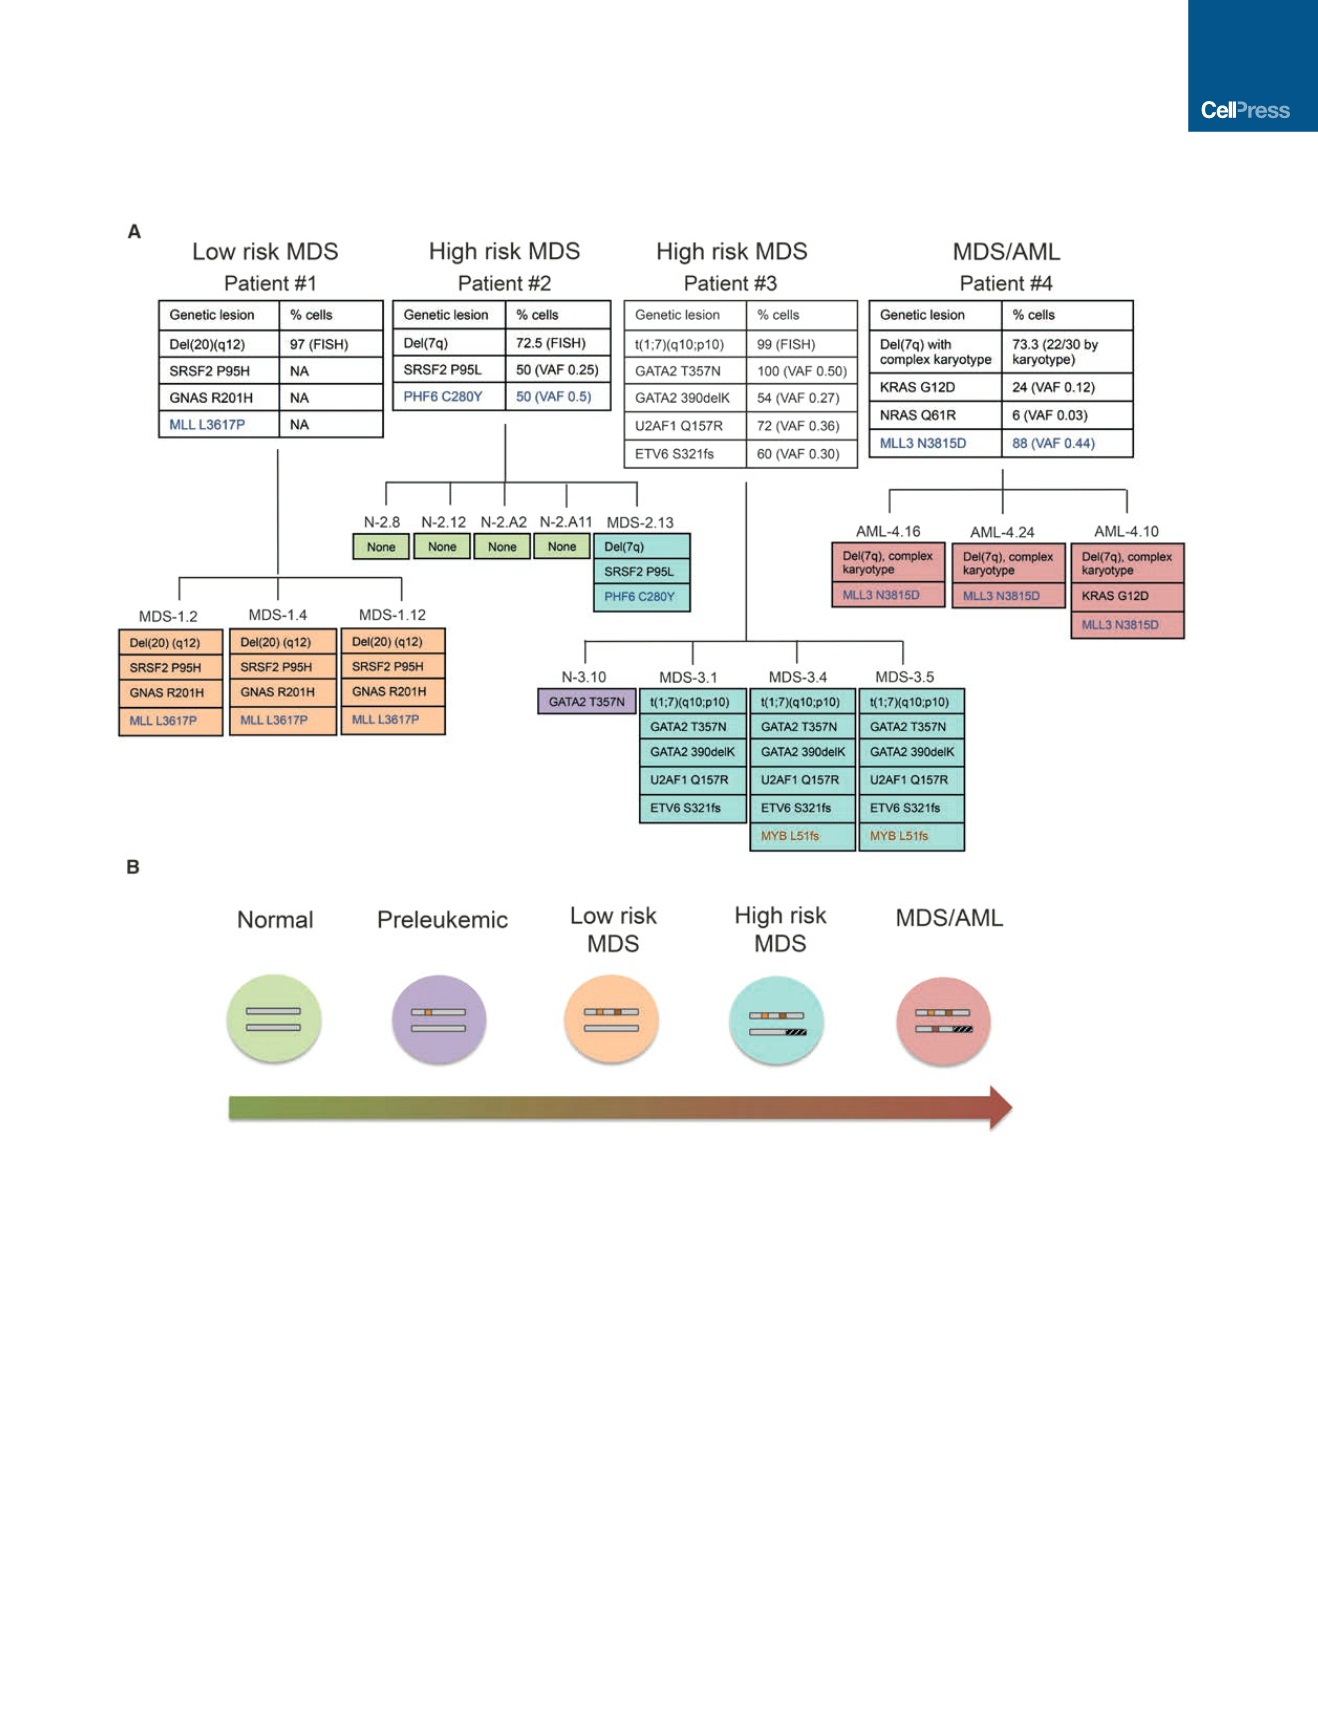
Figure 1. Generation of a Panel of Disease-Stage-Specific iPSCs
(A) iPSCs derived from four patients: one with low-risk MDS, two with high-risk MDS, and one with MDS/AML. The top panels show all recurrent gene mutations
and chromosomal abnormalities detected in the starting cells used for reprogramming and their frequency. The bottom panels show the individual iPSC lines that
were derived and their corresponding genetic profile. Blue font indicates gene mutations of uncertain significance. Brown font indicates mutations detected in the
derivative iPSCs, but not in the starting cells. Patient 4 cells and the derivative iPSCs harbor a complex translocation among chromosomes 1, 7, and 14, resulting
in a deletion of 7q (confirmed by aCGH; Figure S2B) and additional material of unknown origin on chromosome 15 (46,XX,der(1)t(1;7;14)(q32;p11p22;p11.1),
der(7)del(7)(p11p22)inv(7)(p11q31),der(14)t(1;14)(q32;p11.1),add(15)(p11.1)). VAF, variant allele frequency.
(B) iPSC lines from (A) (note color code) capture distinct disease stages ranging from normal, preleukemic (i.e., cells with predisposing mutations), low-risk MDS,
high-risk MDS, and MDS/AML.
See also Figures S1 and S2 and Tables S1 and S2.
Cell Stem Cell
20
, 315–328, March 2, 2017
317