


 122 128

derived from the N-3.10 line, in which both
GATA2
alleles
harbored inactivating frameshift indels, as well as a third clone
that retained the mutant T357N allele and harbored a deletion
of the zinc-finger 2 domain (where many of the mutations found
in patients cluster), predicted to abolish DNA binding (Figures
6G, S7A, and S7B) (Collin et al., 2015; Hahn et al., 2011). Since
the MDS clone in this patient also had loss of chr7q in the context
of a t(1;7) translocation (Figure 1), we also modeled in parallel the
contribution of the del(7q) lesion to the disease progression by
engineering hemizygous chr7q deletion into the preleukemic
N-3.10 line (Figures 6G and S7C). Phenotypic characterization
of the three independent
GATA2
-engineered clones and of three
independent del(7q) clones, compared to the patient-derived
parental preleukemic N-3.10 and MDS lines, revealed a modest
reduction in the CD45
+
cell population concomitant with a reten-
tion of the CD90 marker in the
GATA2
-engineered clones, while
the del(7q) clones showed a dramatic decrease in CD45
+
cells
and a much more prolonged expression of CD90 (Figures 6H
rise to predominantly CD19
+
B lymphoid cells. In contrast, MDS/AML-iPSC-derived hematopoietic cells generate predominantly myeloid cells. Each data point
represents a unique mouse. Mean and SEM of different mice from three experiments are shown.
(E) Spleen weight in recipient mice 8–11 weeks post-transplantation with human cord blood CD34
+
cells (CB) or MDS/AML-iPSC-derived hematopoietic cells, as
indicated. Each data point represents a unique mouse. Mean and SEM of different mice from three experiments are shown.
(F) Engraftment levels in the bone marrow, spleen, and peripheral blood of primary and secondary recipient mice transplanted with hematopoietic cells derived
from lines AML-4.24 and AML-4.10 (primary) or AML-4.10 (secondary). Each data point represents a unique mouse. Error bars show the mean and SEM.
(G) May-Giemsa-stained cytospin of bone marrow cells of a secondary recipient mouse transplanted with AML-4.10-derived hematopoietic cells. Scale
bar, 100
m
m.
(H) Human CD45 detection by immunohistochemistry in the bone marrow of a secondary recipient mouse transplanted with AML-4.10-derived hematopoietic
cells. Scale bar, 50
m
m.
(I) Schematic summary of phenotypic analyses shown in Figures 2, 3, and 4.
See also Table S3.
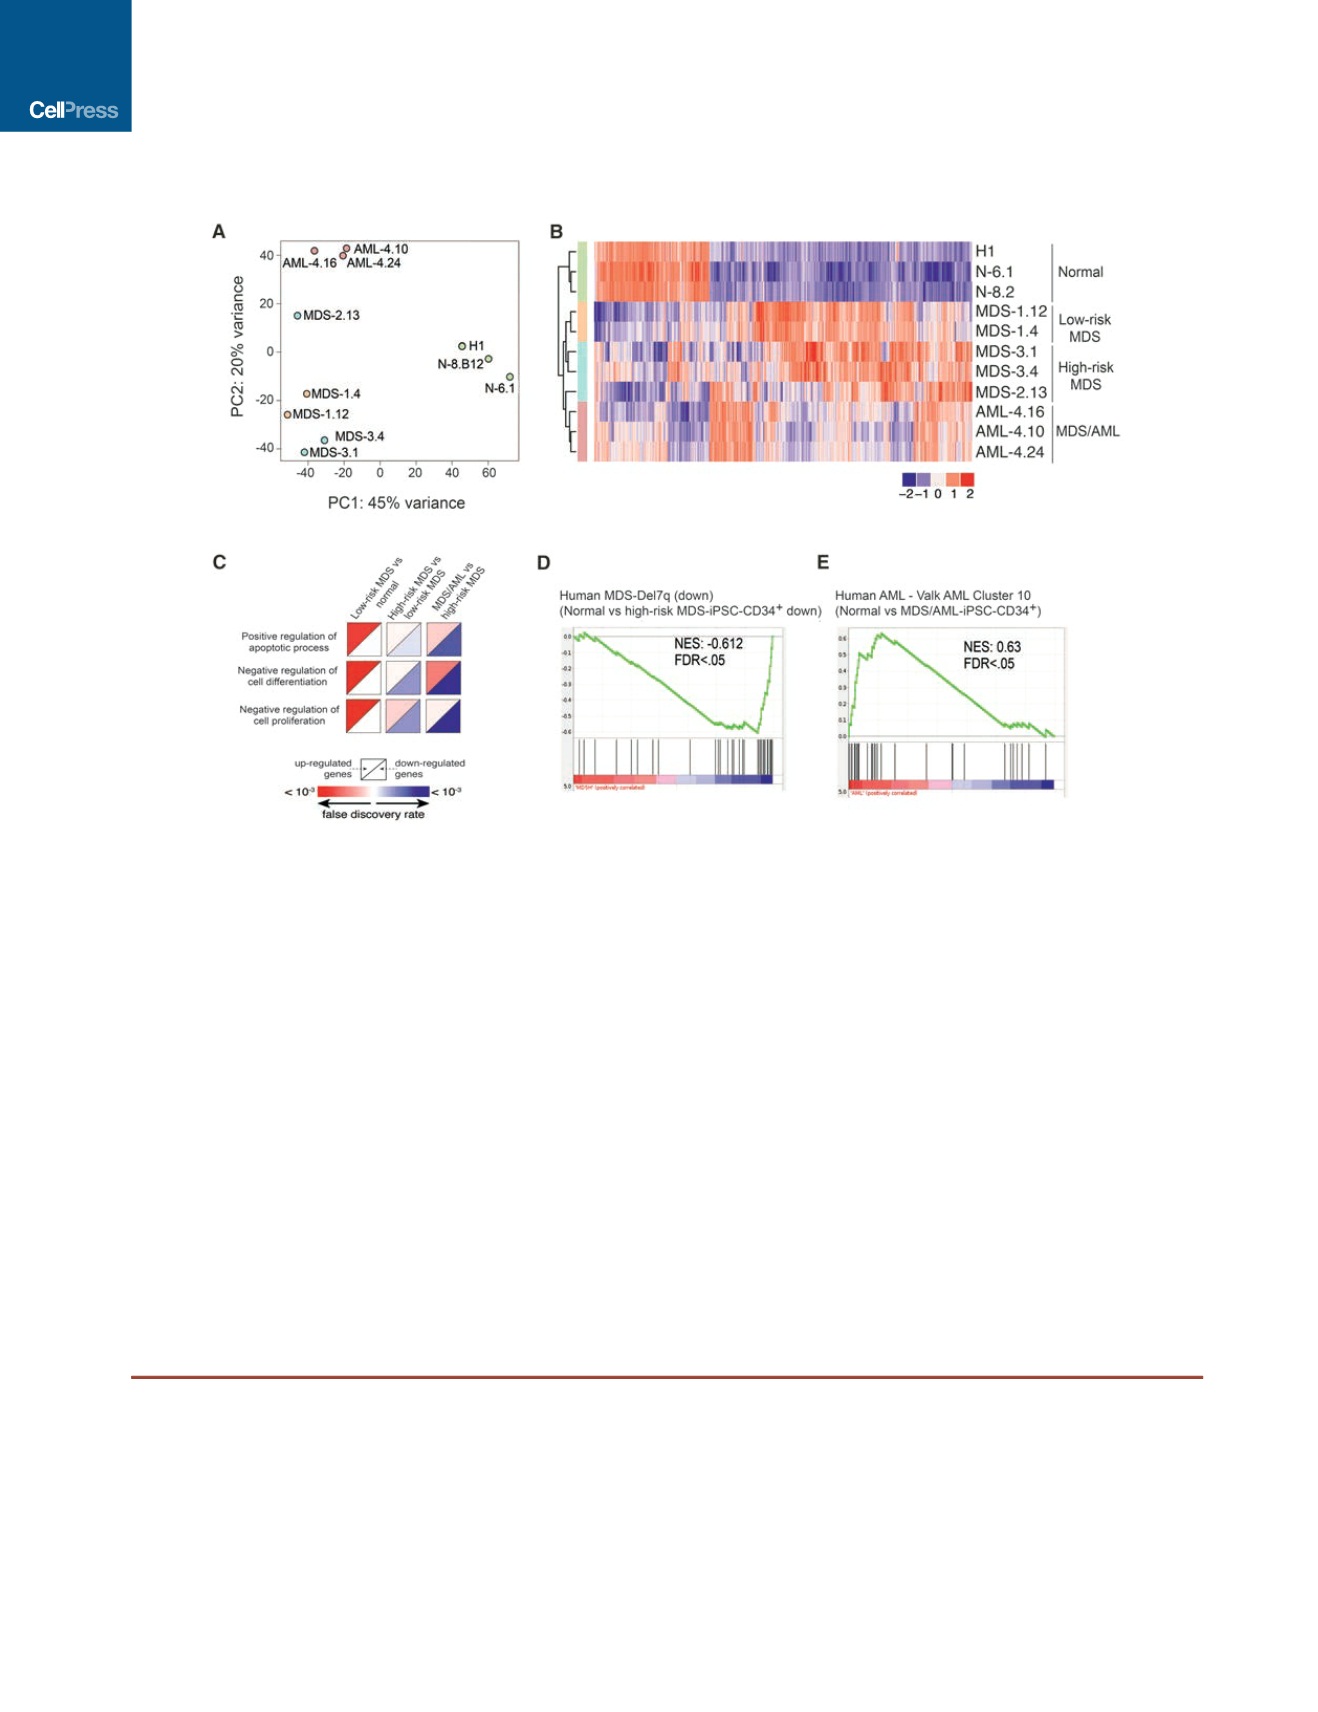
Figure 5. Gene Expression Analysis
(A) Principal-component analysis on regularized log transformed normalized read counts cluster samples by disease status.
(B) Hierarchical clustering of CD34
+
HPCs derived from the different iPSC lines based on a total of 2,018 genes differentially expressed between MDS/AML versus
normal, high-risk MDS versus normal and low-risk MDS versus normal using scaled log normalized counts.
(C) Gene Ontology (GO) enrichment for genes differentially expressed between low-risk MDS versus normal, high-risk MDS versus low-risk MDS, and high-risk
MDS versus MDS/AML.
(D) Gene set enrichment analysis (GSEA) of high-risk MDS-iPSC-CD34
+
cells compared to normal iPSC-CD34
+
cells shows negative enrichment for down-
regulated genes in human high-risk MDS patients harboring a del7q.
(E) GSEA of MDS/AML-iPSC-CD34
+
cells compared to normal iPSC-CD34
+
cells shows negative enrichment for the human AML Valk cluster 10 patient gene set
(group with worse prognosis and chr7q abnormalities) (Valk et al., 2004).
See also Figure S6 and Table S4.
322
Cell Stem Cell
20
, 315–328, March 2, 2017