


 124 128

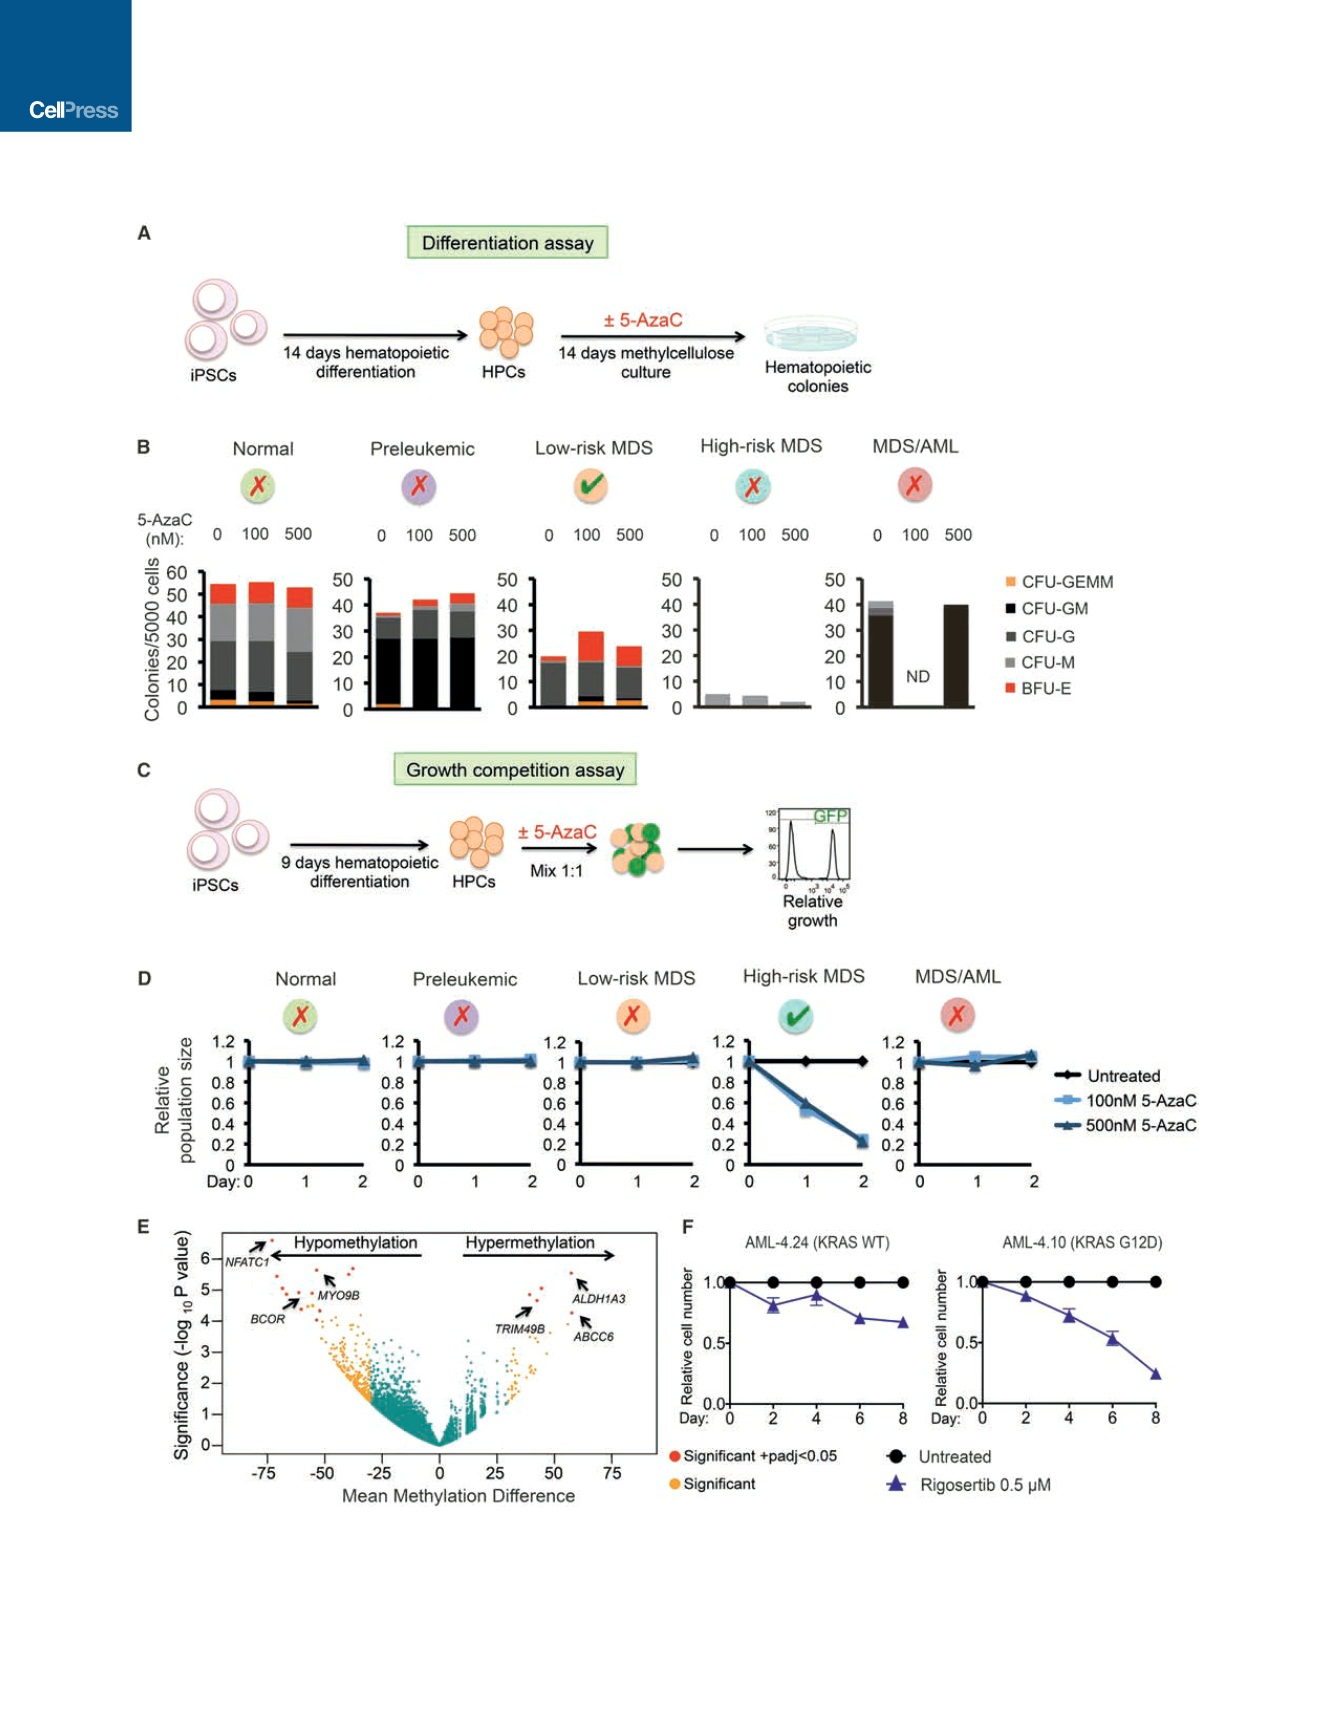
Figure 7. Disease-Stage-Specific Drug Responses
(A) Schematic of experimental design to test the effects of 5-AzaC in differentiation.
(B) Methylcellulose assays at day 14 of hematopoietic differentiation in the presence or absence of 5-AzaC. The number of colonies from 5,000 seeded cells
is shown. Normal, average of H1 (two independent experiments) and N-2.12; preleukemic, N-3.10; low-risk MDS, average of MDS-1.2 and MDS-1.12 (four
independent experiments); high-risk MDS, MDS-3.4; MDS/AML, AML-4.10 and AML-4.24.
(legend continued on next page)
324
Cell Stem Cell
20
, 315–328, March 2, 2017