


 120 128

Consistent with this, detailed phenotypic characterization,
based on the phenotypic assays defined in the iPSC panel
above, confirmed a phenotype corresponding to a preleukemic
stage: correction of the emergence of CD45
+
cells, loss of
CD90 expression, re-emergence of a CD41a
+
/CD45 megakar-
yocyte progenitor population, partial rescue of clonogenicity,
and restored growth and viability (Figures 6B–6F).
Conversely, to model disease progression, we first started
with the preleukemic N-3.10 line, harboring a germline
GATA2
mutation.
GATA2
mutations found in patients with familial pre-
disposition syndromes are believed to be loss-of-function muta-
tions (Collin et al., 2015). Since the MDS clone of the same
patient from whom this line was derived (patient 3; Figure 1)
had acquired a second
GATA2
mutation in the other allele (Fig-
ure S1A) together with additional recurrent genetic abnormal-
ities, we sought to model the effects of inactivating the other
GATA2
allele in the disease phenotype. We designed two
distinct CRISPR/Cas9-based strategies and isolated two clones
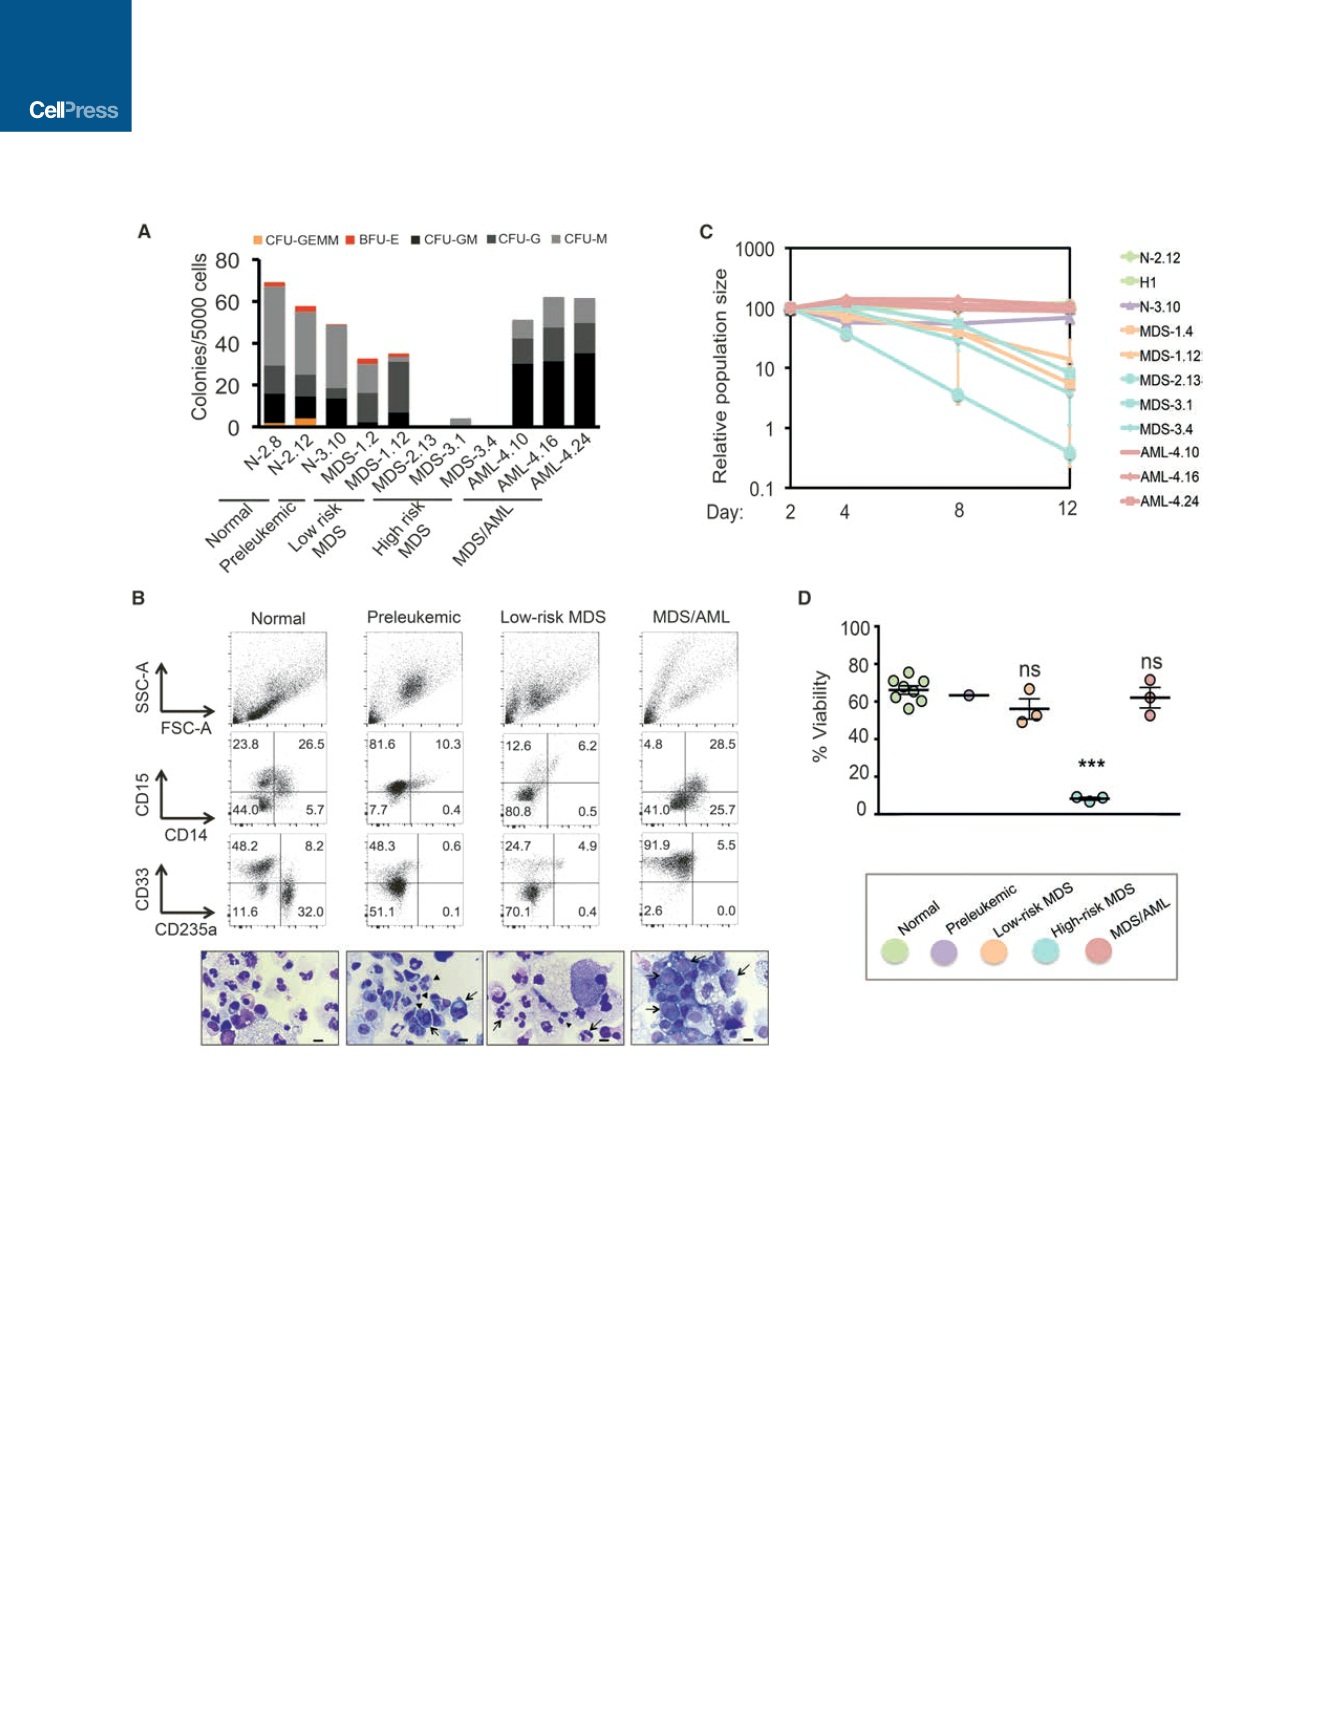
Figure 3. iPSCs from Different Disease Stages Capture Stage-Specific Disease Phenotypes
(A) Methylcellulose assays on day 14 of hematopoietic differentiation. The number of colonies from 5,000 seeded cells is shown. (CFU-GEMM, colony-forming
unit-granulocyte, erythrocyte, monocyte, megakaryocyte; CFU-GM: CFU-granulocyte, monocyte; CFU-G: colony-forming unit-granulocyte; CFU-M: CFU-
monocyte; BFU-E, burst-forming unit-erythrocyte). Average of three to six independent experiments is shown for each line.
(B) Analysis of lineage markers (top) and morphologic assessment of cells generated in methylcellulose cultures. One iPSC line representative of each disease
stage is shown (from left to right: N-2.12, N-3.10, MDS-1.12, AML-4.16). High-risk MDS iPSCs do not give rise to colonies in methylcellulose and are therefore not
represented in this panel. Dysplastic changes are observed in preleukemic (arrows point to nuclear blebbing, whereas arrowheads point to pseudo Pelger-Huet
cells) and low-risk MDS cells (arrows point to hyper-segmented neutrophils, whereas arrowheads point to pseudo Pelger-Huet cells). Atypical monomorphic
myeloid cells (arrows) are the predominant cells observed in methylcellulose cultures from MDS/AML cells. Scale bars, 10
m
m.
(C) Growth competition assay. The cells were mixed 1:1 with the N-2.12 line stably expressing GFP at the beginning of hematopoietic differentiation and followed
for 12 days by flow cytometry (schematic shown in Figure S5F). The relative population size was calculated as the percentage of GFP cells at each time point
relative to the population size at day 2. For lines differentiated more than once, the average value is shown.
(D) Cell viability measured by DAPI staining on day 14 of hematopoietic differentiation (extended data are shown in Figure S5E). Mean and SEM of different lines
are shown. For lines differentiated more than once (Figure S5E), the average value is shown.
See also Figure S5 and Table S3.
320
Cell Stem Cell
20
, 315–328, March 2, 2017