


 123 128

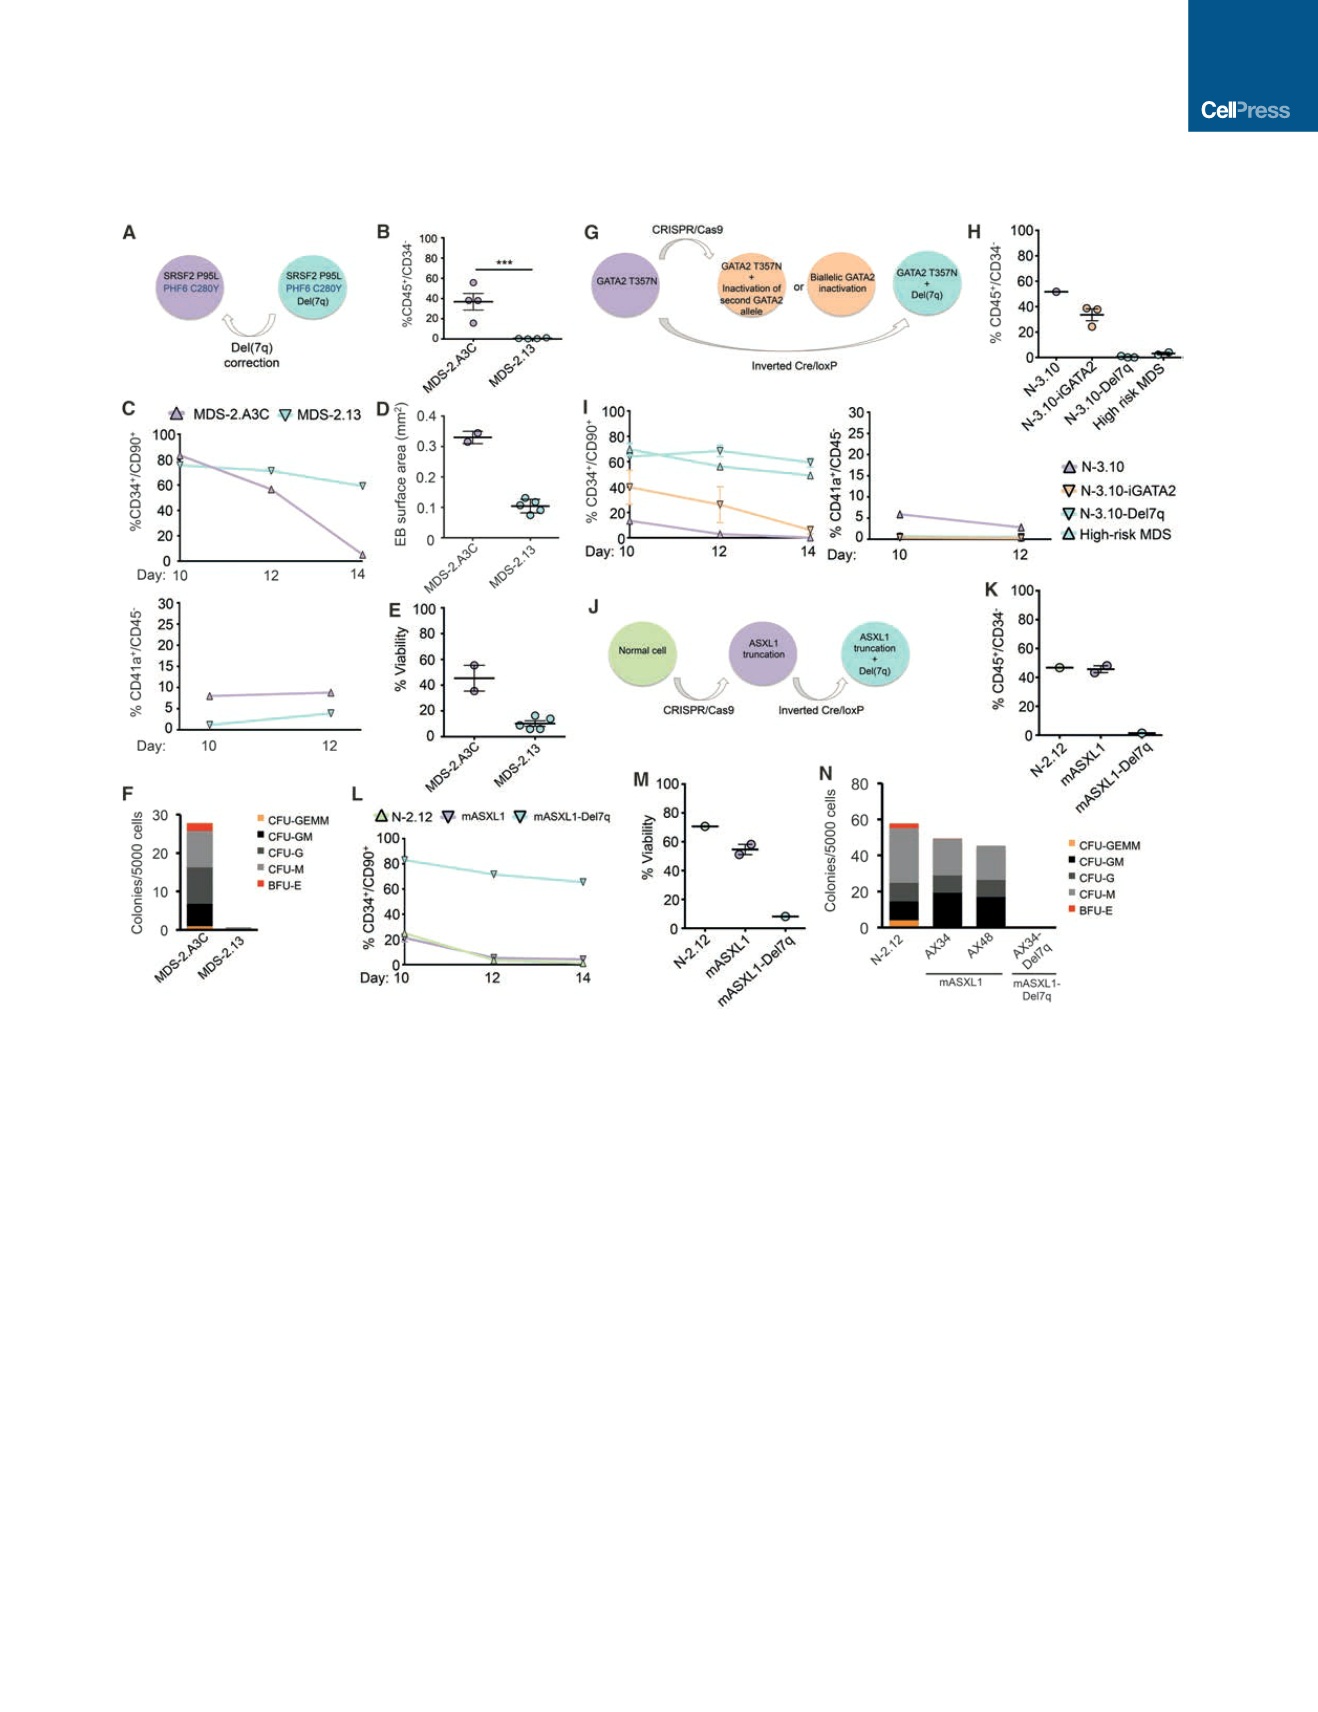
Figure 6. Modeling Disease Stage Transitions
(A) Schematic of reversal of a high-risk MDS line to a stage phenotypically consistent with a preleukemic stage through spontaneous correction of a chr7q deletion.
(B) Fraction of CD45
+
/CD34 cells at day 14 of differentiation. Mean and SEM from independent differentiation experiments are shown.
(C) Fraction of CD34
+
/CD90
+
cells at the indicated days of differentiation. Average of independent differentiation experiments is shown for each line (top). Fraction
of CD41a
+
/CD45 cells at the indicated days of differentiation (Bottom). Average of independent differentiation experiments are shown for each line.
(D) EB surface area at day 8 of hematopoietic differentiation. Mean and SEM from independent differentiation experiments are shown for each line. 10 EBs were
measured in each experiment and averaged for each data point.
(E) Cell viability measured by DAPI staining on day 14 of hematopoietic differentiation. Mean and SEM from independent differentiation experiments are shown for
each line.
(F) Methylcellulose assays on day 14 of hematopoietic differentiation. The number of colonies from 5,000 seeded cells is shown.
(G) Schematic of progression of a preleukemic line (N-3.10), harboring a heterozygous germline
GATA2
mutation, to a stage corresponding phenotypically to low-
risk MDS through CRISPR/Cas9-mediated monoallelic or biallelic
GATA2
inactivation and to a high-risk MDS stage through loss of a copy of chr7q.
(H) Fraction of CD45
+
/CD34 cells on day 14 of differentiation. Mean and SEM of three different
GATA2
-edited and three del7q-engineered clones with average
values from two independent differentiations per line are shown.
(I) Fraction of CD34
+
/CD90
+
cells at the indicated days of differentiation (left). Average values of three different
GATA2
-edited and three del7q-engineered clones
with values averaged from two independent differentiation experiments per line are shown. Fraction of CD41a
+
/CD45 cells at the indicated days of differentiation
(fight). Average values of three different
GATA2
-edited and three del7q-engineered clones with values averaged from two independent differentiation experi-
ments per line are shown.
(J) Schematic of successive progression of a normal line (N-2.12) to a preleukemic stage through CRISPR/Cas9-mediated
ASXL1
mutation and subsequently to a
high-risk MDS stage through engineering of del(7q).
(K) Fraction of CD45
+
/CD34 cells on day 14 of differentiation. Mean and SEM of two different
ASXL1
-edited clones, one
ASXL1
-edited and del7q-engineered
clone, and the parental line with average values from three independent differentiations per line are shown.
(L) Fraction of CD34
+
/CD90
+
cells at the indicated days of differentiation. Average values of two different
ASXL1
-edited clones and one
ASXL1
-edited and del7q-
engineered clone with values averaged from three independent differentiation experiments per line are shown.
(M) Cell viability measured by DAPI staining on day 14 of hematopoietic differentiation. Mean and SEM of two different
ASXL1
-edited clones and one
ASXL1
-
edited and del7q-engineered clone with average values of three independent differentiations per line are shown.
(N) Methylcellulose assays on day 14 of hematopoietic differentiation. Shown are values averaged from two or three independent differentiation experiments per line.
See also Figure S7.
Cell Stem Cell
20
, 315–328, March 2, 2017
323