


 118 128

with the remaining 15 derived from normal cells), whereas the
del(7q) was present in over 70% of the starting cells (Table
S1). To further investigate this and to determine whether the
in vitro culture that is necessary to initiate reprogramming or
the reprogramming process per se accounts for this skewing,
we compared the clonal composition of cells from patient 2
before (day 0) and after in vitro culture (day 3) (Figures S1B
and S1C). This showed that in vitro culture did not select for
normal cells but rather resulted in preferential growth of the
MDS clone over the normal cells, since the variant allele fre-
quency (VAF) of both
SRSF2
P95L and
PHF6
C280Y clonal so-
matic mutations increased over time in culture. Similarly, cells
from patients 7 and 8 analyzed for the del(5q) abnormality after
culture and immediately before the initiation of reprogramming
were found to consist mostly of clonal MDS cells, as the copy
number of chr5q was almost 1 in both samples and 8 out
of 10 metaphases of patient 7 cells harbored the del5q by
karyotyping (Figures S1D and S1E). Finally, we compared
the outcome of two different reprogramming protocols using
in vitro expansion and reprogramming of either hematopoietic
progenitors or erythroblasts, performed in parallel with the
same aliquot of starting cells divided in two (Table S2). Eryth-
roblast reprogramming, similarly to hematopoietic progenitor
reprogramming, preferentially gave rise to normal iPSCs. These
results show that the relative reprogramming disadvantage of
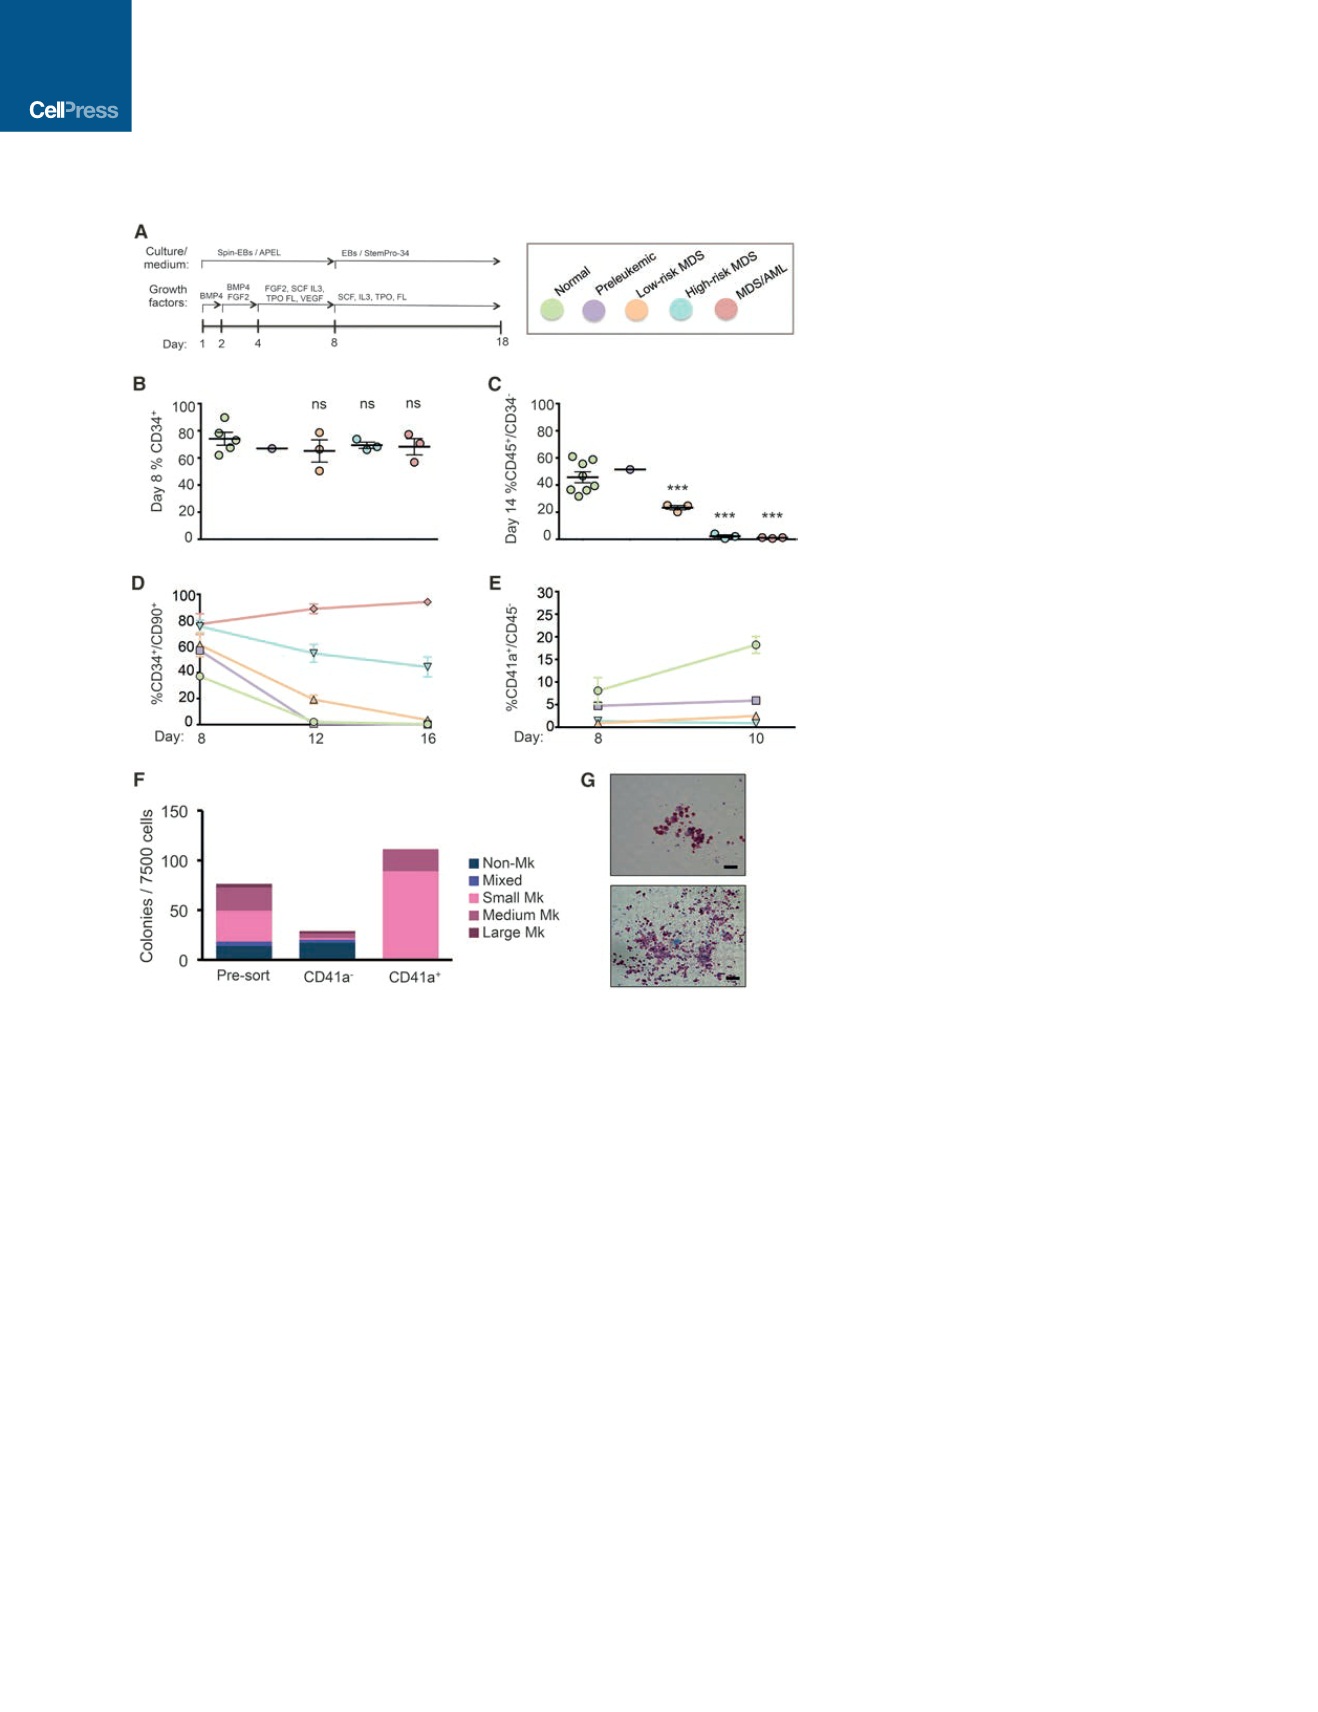
Figure 2. Disease-Stage-Specific iPSCs Capture
Phenotypes of Graded Severity
(A) Scheme of hematopoietic differentiation protocol.
(B) Fraction of CD34
+
cells generated by all the different
lines tested on day 8 of differentiation (extended data
are shown in Figure S3C). Note color coding (key is
shown in the top right panel of this figure). Mean and
SEM of different lines are shown. For lines differentiated
more than once (Figure S3C), the average value is
shown.
(C) Fraction of more mature CD45
+
cells that have lost
CD34 expression by day 14 of differentiation generated
by the different iPSC lines (extended data are shown in
Figure S3F). Mean and SEM of different lines are shown.
For lines differentiated more than once, and the average
value is shown.
(D) Fraction of CD34
+
cells maintaining CD90 expression
at the indicated days of differentiation (extended data
are shown in Figure S4B, top). For lines differentiated
more than once, the average value is shown.
(E) Fraction of CD41a
+
/CD45 cells, corresponding to
megakaryocyte progenitors, at the indicated days of
differentiation (extended data are shown in Figure S4B,
bottom). For lines differentiated more than once, the
average value is shown.
(F) Colony assays for megakaryocyte progenitors (CFU-
Mk) in unsorted, CD41a
+
, and CD41a sorted cells from
N-2.12 iPSCs at day 8 of differentiation. The average of
two independent experiments is shown.
(G) Representative images of a medium (top) and large
(bottom) CFU-Mk colony. Scale bars, 50
m
m.
See also Figures S3 and S4 and Table S3.
MDS cells from some patients is not due to
in vitro culture and suggest that some MDS-
associated genetic lesions, but not others,
exert a negative effect on or even completely abolish reprog-
ramming potential.
Disease-Stage-Specific iPSCs Capture Cellular
Phenotypes of Graded Severity or Disease Specificity
We selected a panel of iPSC lines representative of the different
disease stages for phenotypic characterization following he-
matopoietic differentiation using a protocol that enables the
derivation and study of hematopoiesis with definitive features
(Figures 2A, S3A, and S3B). All lines gave rise to comparable per-
centages of CD34
+
cells early in differentiation (day 8), providing
evidence against early developmental defects in mesoderm for-
mation or hematopoietic lineage specification that could com-
pound the identification of disease-relevant phenotypes (Figures
2B and S3C). In contrast, striking differences were observed in
the timing and emergence of CD45
+
hematopoietic progenitor
cells (HPCs) starting at the low-risk MDS stage (Figures 2C
and S3D–S3F). Preleukemic cells, like normal cells, generated
CD45
+
HPCs that comprised 90% of the cells by day 14 of dif-
ferentiation, with approximately half having lost CD34 expres-
sion, as a sign of further maturation beyond the progenitor stage
(Figures 2C, S3E, and S3F). Low-risk MDS CD45
+
HPCs ap-
peared later and matured later than normal HPCs, as evidenced
by loss of CD34 (Figures 2C, S3E, and S3F). High-risk MDS
iPSCs produced CD45
+
HPCs with a delay, as well as markedly
318
Cell Stem Cell
20
, 315–328, March 2, 2017