


 90 128

responsible for these interactions (Chu et al., 2015). To identify
proteins that potentially interact with the
Bvht
AGIL motif, we
used a human protein microarray platform that has successfully
identified lncRNA-binding proteins (Kretz et al., 2013; Siprashvili
et al., 2012). Full-length
Bvht
and
bvht
dAGIL
transcripts were
generated by in vitro transcription and labeled with Cy5 (Fig-
ure S4A; Table S2). Equal concentrations of labeled transcript
were then individually incubated with the protein microarray
A
B
Day 5.3
Nkx2.5-GFP FITC
10 0 10 1 10 2 10 3 10 4 10 5
0
20
40
60
80
100
71.4%
1.16%
cTnT APC
Day 10
72.2%
0.08%
10 0
10 2
10 4
10 6
0
20
40
60
80
100
WT
bvht
dAGIL
#1
WT
bvht
dAGIL
#1
Percentage of Max
10 3
10 5
10 1
C
Brachyury
Relative levels of transcript
Day 4 Day 5.3
0
1
2
3
4
WT
bvht
dAGIL
#
1
bvht
dAGIL
#2
****
****
0
2
4
10
ESC
MES CP
CM
Day
Activin A
BMP4
VEGF
bFGF
FGF-10
VEGF
Embryoid bodies
5.3 6
E
D
BF
GFP
DAPI
Merge
bvht
dAGIL
#1 WT
Day 5.3
bvht
dAGIL
#1 WT
BF
cTnT
DAPI
Merge
Day 10
Day 2 Day 4
bvht
dAGIL
#1
WT
10 0 10 1 10 2 10 3 10 4 10 5
10 0
10 1
10 2
10 3
10 4
10 5
10 0 10 1 10 2 10 3 10 4 10 5
10 0
10 1
10 2
10 3
10 4
10 5
WT
bvht
dAGIL
#1
Day 4
Day 4
PdgfR
α
PE
0.38%
23.8%
45.1%
30.7%
3.45%
19.4%
62.0%
15.1%
Flk1 APC
bvht
dAGIL
#1
WT
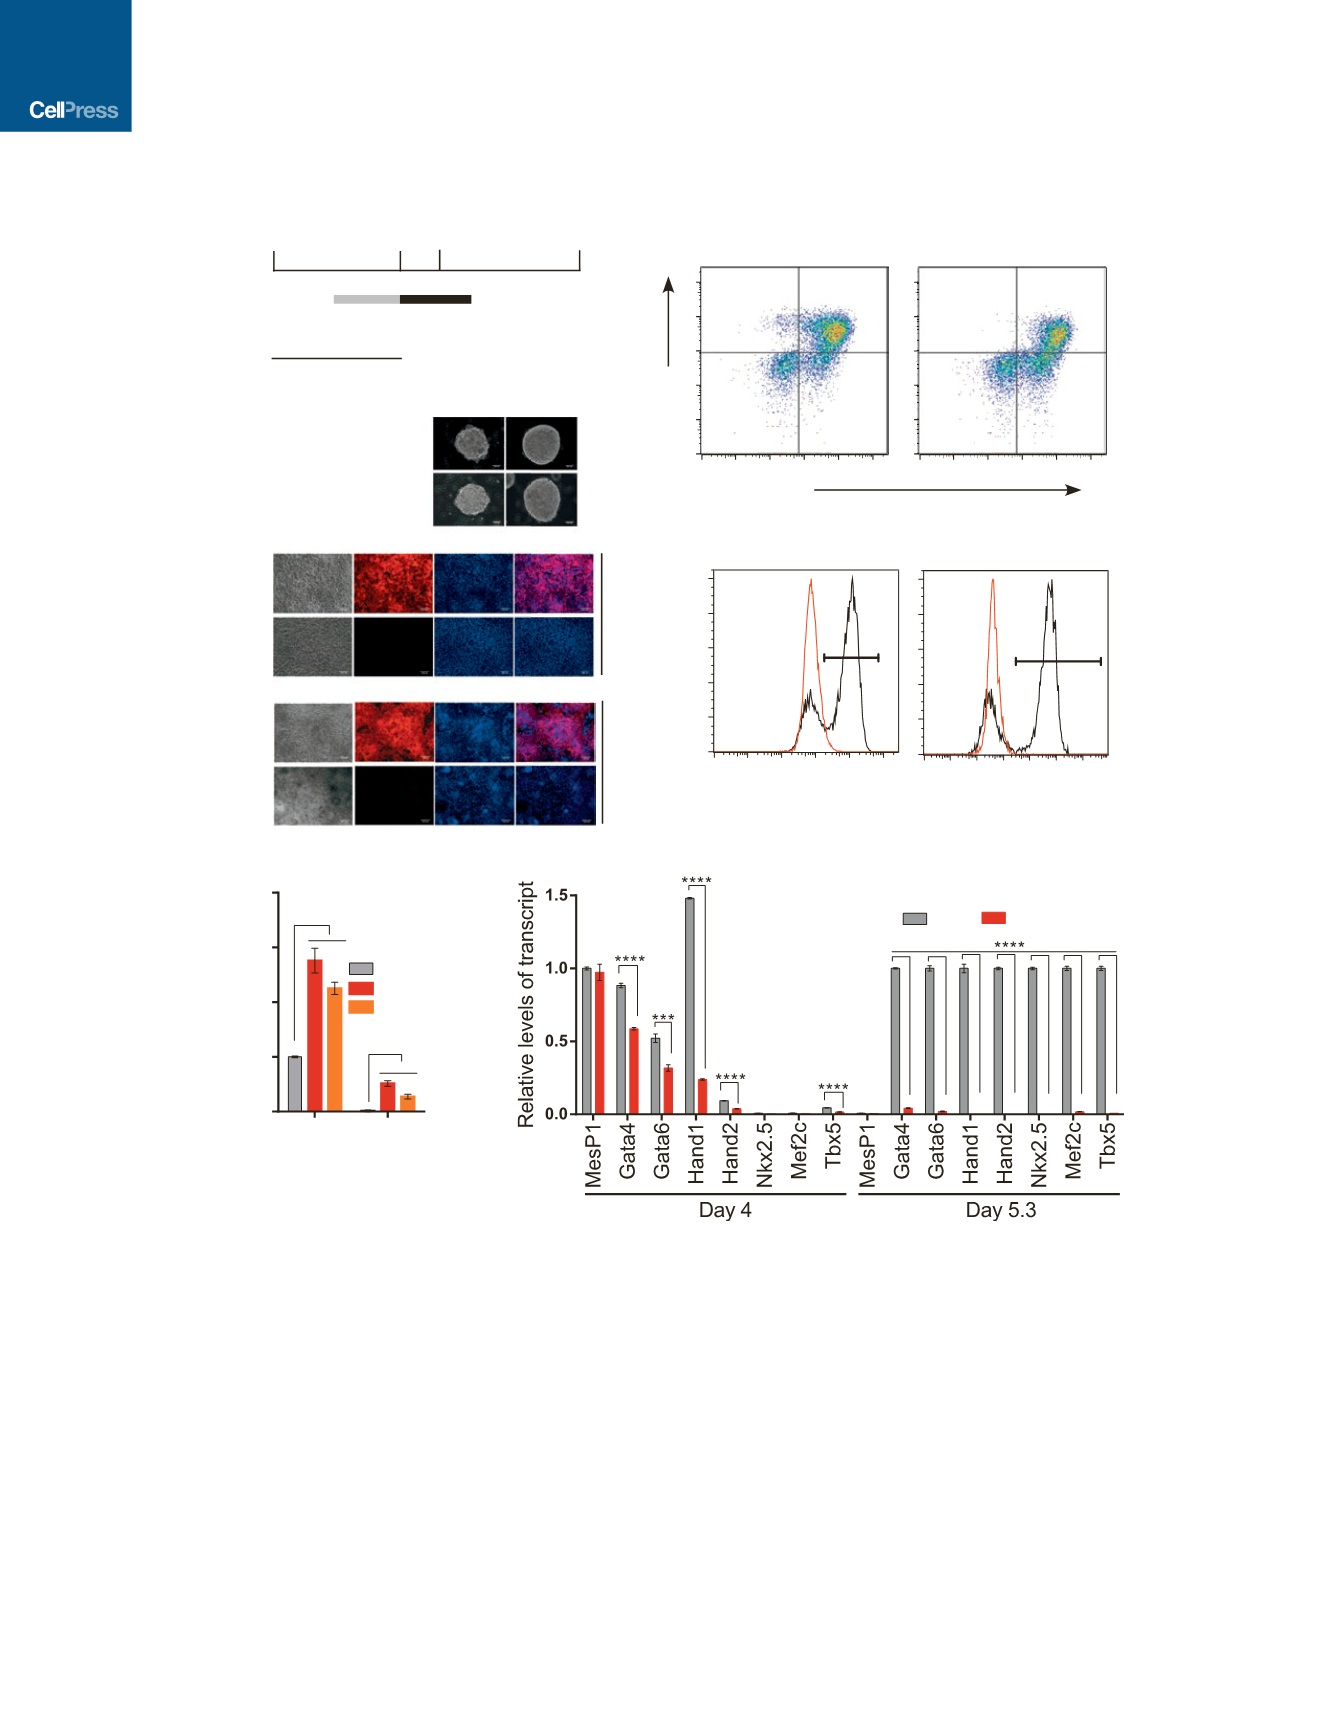
Figure 3.
Bvht
AGIL Motif Is Necessary for Cardiovascular Lineage Commitment
(A) Timeline of CM differentiation protocol. Black and gray bars represent the time period where differentiating cultures were treated with the growth factors listed
below each respective bar.
(B) Cells at indicated time points were analyzed for marker expression by flow cytometry. Numbers in plots indicate percentage of gated populations.
(C) Immunofluorescence staining of indicated cells using anti-GFP (day 5.3) and anti-cTnT (day 10) antibodies. Nuclei were stained with DAPI. BF, bright field.
Scale bar, 100
m
m.
(D and E) qRT-PCR analysis showing the relative levels of Brachyury (D) and cardiac (E) TFs at day 4 and day 5.3 from indicated ESC lines. WT value at day 4 (D)
and day 5.3 (E) is set to 1 for each gene.
All experiments were performed in triplicate and data are represented as mean values ± SD. *p<0.05; **p<0.01; ***p<0.001; ****p<0.0001 (two-tailed Student’s
t test).
See also Figure S3.
42
Molecular Cell
64
, 37–50, October 6, 2016