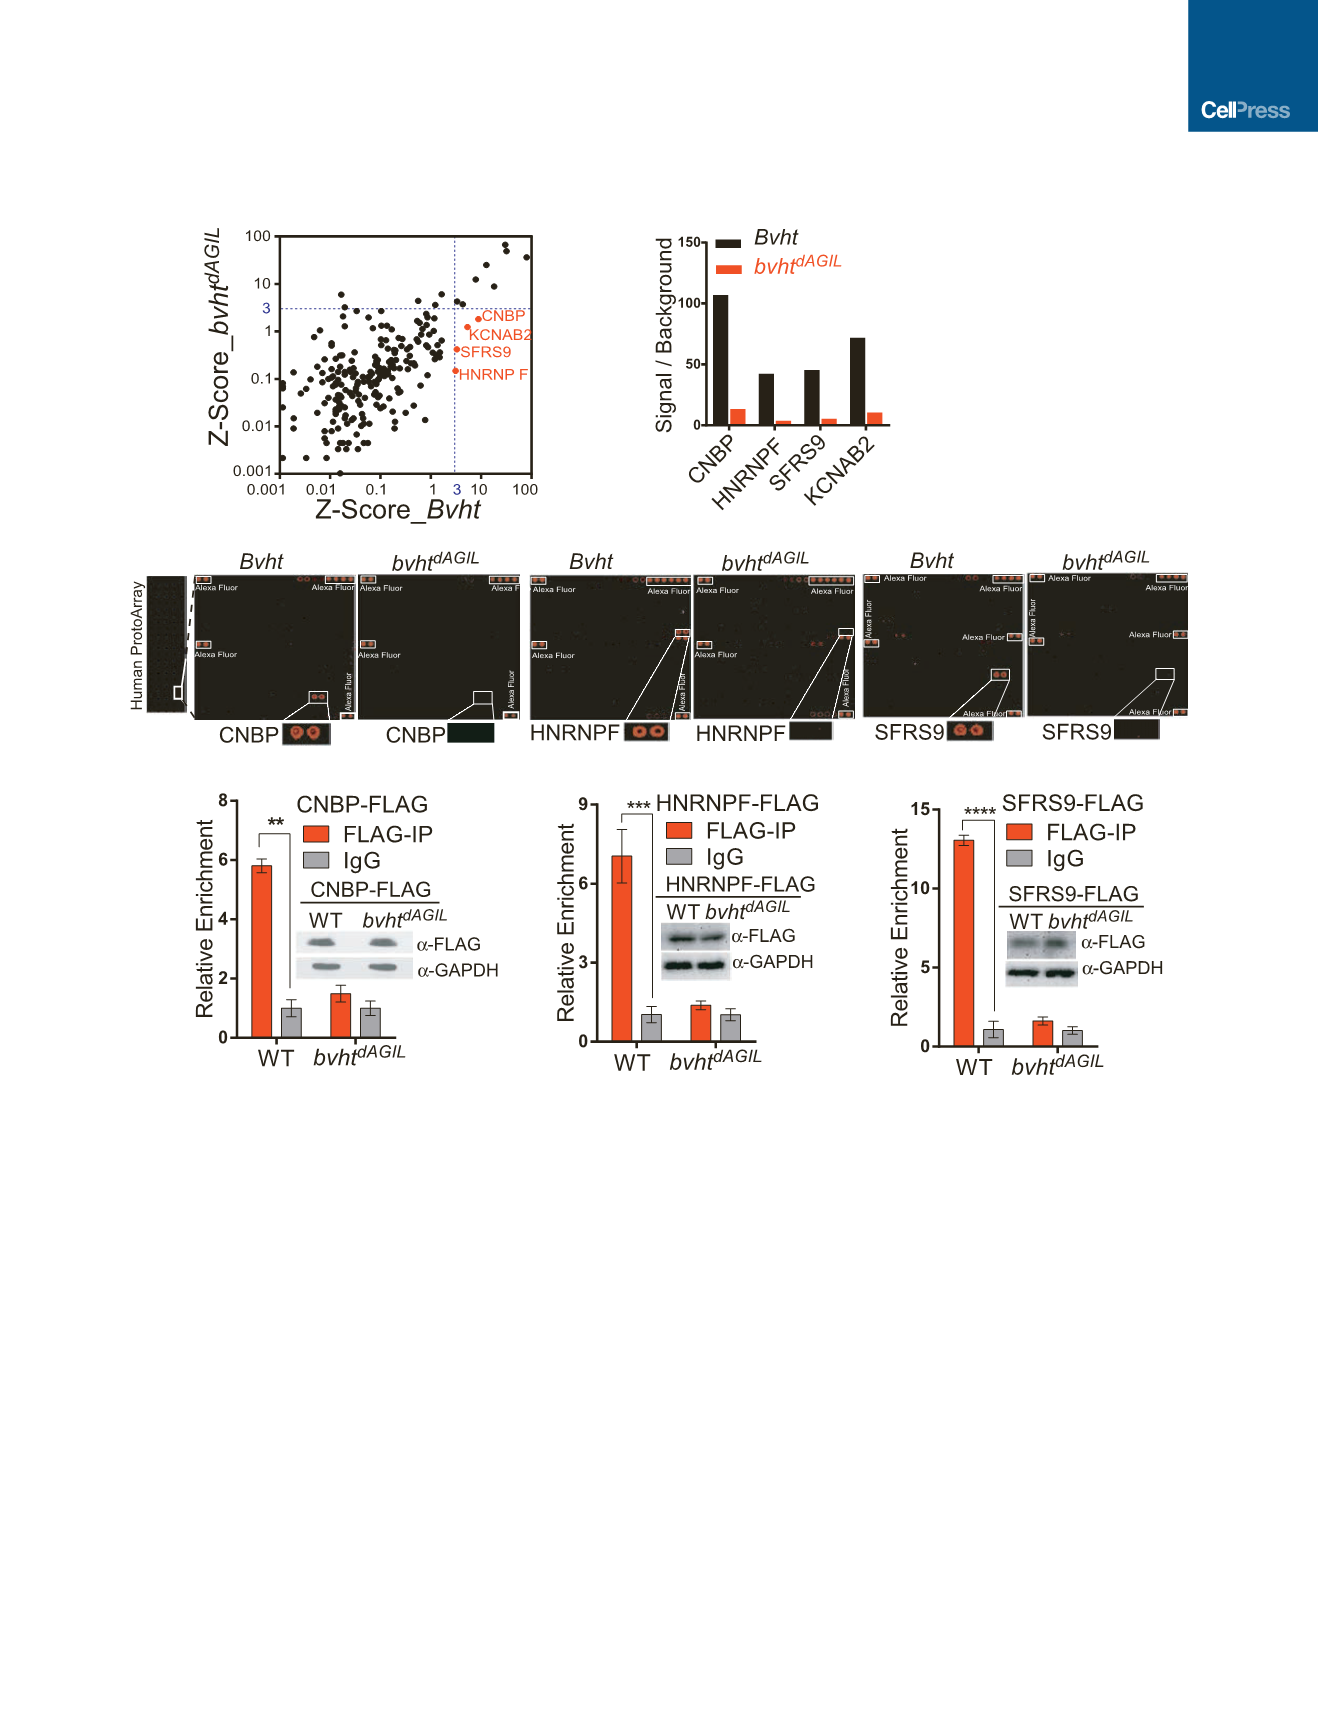

containing 9,400 recombinant human proteins (Human Proto-
Array). Using a stringent cut-off (
Z
score > 3), we identified 12
candidates that strongly interacted with the WT transcript (Fig-
ures 4A and S4B; Table S2). Notably, four of these candidates
(CNBP, HNRNPF, SFRS9, and KCNAB2) showed dramatically
decreased binding when the array was probed with the
bvht
dAGIL
transcript (Figures 4B and 4C). These proteins are conserved be-
tween mouse and human and are highly expressed across the
differentiation time course except for KCNAB2 (Figure S4C).
We previously showed that
Bvht
interacts with the Polycomb
A
C
D
B
Figure 4.
Bvht
Interacts with CNBP, a Zinc-Finger TF
(A) Protein microarray analysis detecting
Bvht
-interacting proteins. Cy5-labeled
Bvht
and
bvht
dAGIL
transcripts were incubated with a human recombinant protein
microarray.
Z
scores of fold-change signal intensity over background are depicted in the scatterplot. The dashed blue line represents the
Z
score cutoff used to
select significant RNA-protein binding events. The significant
Bvht
-binding proteins are colored in red. The horizontal axis is
Bvht
, and the vertical axis for
bvht
dAGIL
. A logarithmic scale was used to display both axes.
(B) Quantification of human protein microarray showing fold changes of signal intensity over background for indicated proteins. Values are the average of
duplicate protein spots.
(C) Image of human protein microarray (left) and enlarged subarray (right) showing that mutation of AGIL motif dramatically reduces the interaction between
Bvht
and CNBP, HNRNPF, and SFRS9. Alexa Fluor 647-labeled rabbit anti-mouse IgG or anti-human IgA2 in corners and middle edge of each subarray are used for
reference.
(D) RNA immunoprecipitation showing the interaction between
Bvht
and CNBP, HNRNPF, and SFRS9 in ESCs. Flag-tagged CNBP, HNRNPF, or SFRS9 was
constitutively expressed in both WT and
bvht
dAGIL
ESCs. Immunoblot analysis using anti-Flag antibody shows equal expression levels of Flag-tagged CNBP,
HNRNPF, and SFRS9 in indicated ESCs. Mouse IgG was used for negative control.
All experiments were performed in triplicate and data are represented as mean values ± SD. *p<0.05; **p<0.01; ***p<0.001; ****p<0.0001 (two-tailed Student’s
t test).
See also Figure S4 and Table S2.
Molecular Cell
64
, 37–50, October 6, 2016
43


