


 55 128

of doxycycline treatment, over 80% of the target transcript was
depleted, indicating that CRISPRi can precisely and temporally
control efficient knockdown of the transcript of interest.
CRISPRi Knockdown in Cardiac Mesoderm and iPS-CMs
To determine if loss-of-function approaches using CRISPRi can
be applied in differentiated cell types, we targeted the cardiac
mesoderm-specific transcription factor (
MESP1
) and two known
cardiac-related disease-causing genes (
MYBPC3
and
HERG
).
We established stable polyclonal lines of iPSCs containing
gRNA against these three genes and differentiated them into car-
diac mesoderm or iPS-CMs as described in Experimental Proce-
dures (Figures S6A and S6B). Using a gRNA against these genes,
MESP1
was knocked down by 90% in cardiac progenitor cells,
and
MYBPC3
and
HERG
by 90% and 60%, respectively, in
lactate-purified iPS-CMs (Figure 6A). With western blots and
immunocytochemistry, we observed 90% MYBPC3 protein
knockdown on day-35 lactate-purified iPS-CMs (Figures 6B
and 6C).
Using flow cytometry, we analyzed the doxycycline response
of CRISPRi cells based on mCherry expression (as a surrogate
C
D
g+56
g+24
g+91
GCaMP
CAG
Count
GCaMP
g+91
Scramble
g+56
GCaMP
–
Cntrl
g+24
E
Count
OCT4
Scramble
– Dox
No SNP
(g+22)
OCT4
–
Cntrl
On SNP
(g– 4)
H
SNP
1
5’ UTR
OCT4
TSS
No SNP
(g+22)
On SNP
(g –4)
F
pA
0 1 2 3 4 5 6 7 8 9 10
0
20
40
60
80
100
Days Post-Dox Induction
% of GCaMP
+
Cells
g+24
g+56
g+91
0 1 2 3 4 5 6 7
0
20
40
60
80
100
Days Post-Dox Induction
% of Maximal Median
OCT4 Intensity
Scramble
No SNP (g+22)
On SNP (g –4)
0 1 2 3 4 5 6 7 12 15 17 21
0
20
40
60
80
100
120
Days Post-Dox Induction
% Maximal
BAG3
Expression
Dox
Removed
Dox
Induced
G
A
B
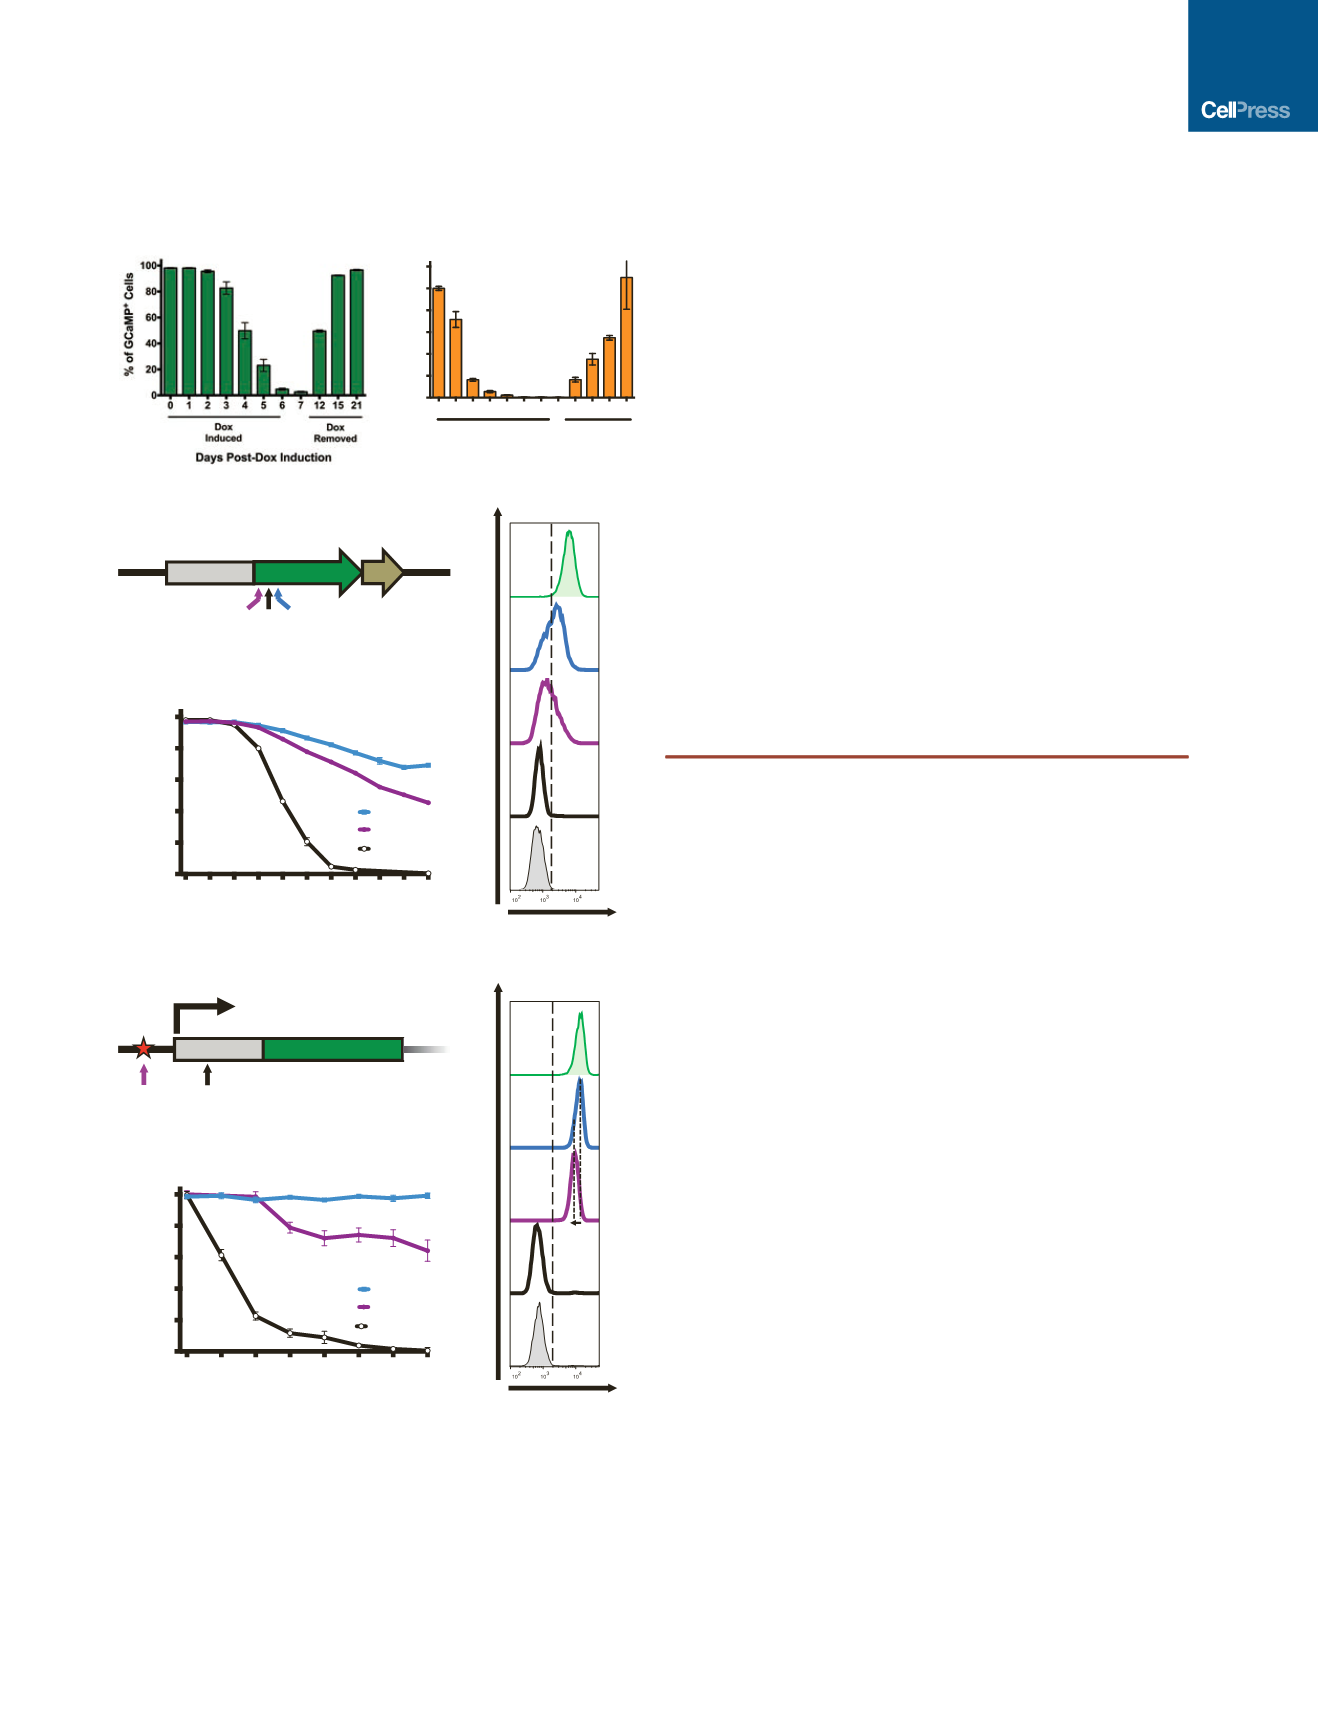
Figure 4. CRISPRi Knockdown Is Reversible and Tunable
A CRISPRi clone containing gRNA against the GCaMP transgene (GCaMP
g+56) and endogenous
BAG3
locus were used to test the knockdown effi-
ciency and reversibility of the CRISPRi system in iPSCs.
(A) Flow cytometry analysis of GCaMP expression showed that after 7 days of
doxycycline induction, GCaMP was knocked down by 99% and was
completely restored after doxycycline withdrawal for 14 days.
(B) Using TaqMan qPCR,
BAG3
transcript levels were knocked down to nearly
undetectable levels, and expression was restored after doxycycline withdrawal.
(C) Schematic diagram of the GCaMP-expression vector in which the
GCaMP open reading frame (ORF) is driven off the CAG promoter. The
locations of three gRNAs (g+24, g+56, and g+91) are schematically
highlighted on the GCaMP ORF. The coordinates of GCaMP gRNA are
based on the translation start site. pA, poly A signal.
(D) Three stable CRISPRi colonies, each containing a different gRNA against
GCaMP, were selected using blasticidin and cultured with doxycycline for
10 days. The percentage of GCaMP-positive cells for each gRNA-containing
clone was plotted as a function of time based on flow cytometry analysis.
Variable levels of GCaMP knockdown ( 30%, 50%, and 99%) were ach-
ieved with different gRNA sequences. n = 1–3 technical replicates for each
time point.
(E) Flow cytometry plots of GCaMP fluorescence of stable CRISPRi clones on
day 10 of doxycycline treatment. Using different gRNAs that target near the
same region, variable levels of knockdown can be achieved. A scramble
gRNA-containing CRISPRi and a GCaMP-negative iPSC population are dis-
played as controls.
(F) Partial schematic diagram of the
OCT4
locus marked with the location of
the TSS and two gRNA-binding locations. Asterisk, an SNP; green box, exon 1;
gray box, 5
0
UTR.
(G) Three stable CRISPRi colonies, two with different gRNAs against
OCT4
and
one with a scrambled control, were selected with blasticidin. Stable clones
that contain either a scramble gRNA, a gRNA that targets a PAM sequence
containing a SNP (
OCT4
g–4), or a gRNA that does not target a SNP (
OCT4
g+22) were treated with doxycycline. The percentage of the maximal median
intensity of OCT4 staining for each gRNA-containing clone is plotted as a
function of time by flow cytometry analysis. Complete loss of
OCT4
expression
(>98% knockdown) was observed after 7 days of doxycycline induction only
when both alleles were targeted using
OCT4
g+22. While using
OCT4
g–4,
which targets only one
OCT4
allele (due to SNP in the PAM sequence), a
gradual loss of OCT4 staining intensity is observed over time (down by 40%
by day 7). Error bars represent SD; n = 1–3 technical replicates for each time
point.
(H) Flow cytometry plots of OCT4 staining on day 7 of doxycycline treatment.
Dashed lines highlight the loss of OCT4-staining intensity ( 40%) when using
OCT4
g–4 compared to the scramble control. By targeting only one allele of
OCT4
, the OCT4-staining intensity homogeneously shifts (while remaining
OCT4-positive), indicating that each cell experiences approximately the same
level of knockdown. Note that the x axis is a log-scale of OCT4 intensity.
Differentiated iPSC-derived fibroblasts (OCT4 Cntrl) and a non-doxycycline-
treated ( Dox) sample are displayed as controls.
Error bars represent SD.
Cell Stem Cell
18
, 541–553, April 7, 2016
ª
2016 Elsevier Inc.
547