


 64 128

with ectopic expression of neural transcription factors (Ladewig
et al., 2012).
We used a lentiviral fluorescent reporter encoding dsRed-
Express under the control of the synapsin I promoter (Syn-
RFP) as a proxy to define the most functionally mature iNs in
the heterogeneous population of reprogrammed cells (Adler
et al., 2012). We readily identified RFP
+
cells with elaborate
arborizations in CR-BAM-transfected PMEFs (Figure 2C). We
also identified rare cells with fibroblastic morphologies reactive
to the Tuj1 antibody in PMEFs following pLuc transfection
1E-4
1E-3
1E-2
1E-1
1E0
1E1
Fold Change mRNA
0
dCas9
VP64
dCas9
VP64
VP64
2000
4000
6000
endoASCL1
8000
Empty
HEK293T
*
1E0
Endogenous Expression
Brn2
Ascl1
Myt1l
1E1
1E2
1E3
1E4
1E5
1E6
Fold Change mRNA
pLuc
pBAM
CR-BAM
Fold Change mRNA
Brn2
Ascl1
Myt1l
Total Expression
B
A
D
C
F
E
*
*
*
*
*
*
Induced Neuronal Cell
Mouse Embryonic Fibroblast
Endogenous Gene
Activation and
Chromatin Remodeling
dCas9
VP64
VP64
BAM gRNAs
DAPI
Brn2
DAPI
Ascl1
pLuc
pBAM
CR-BAM
pBAM
CR-BAM
pBAM
CR-BAM
0
100
200
300
Mean Gray Value (a.u.)
Brn2
Ascl1
*
*
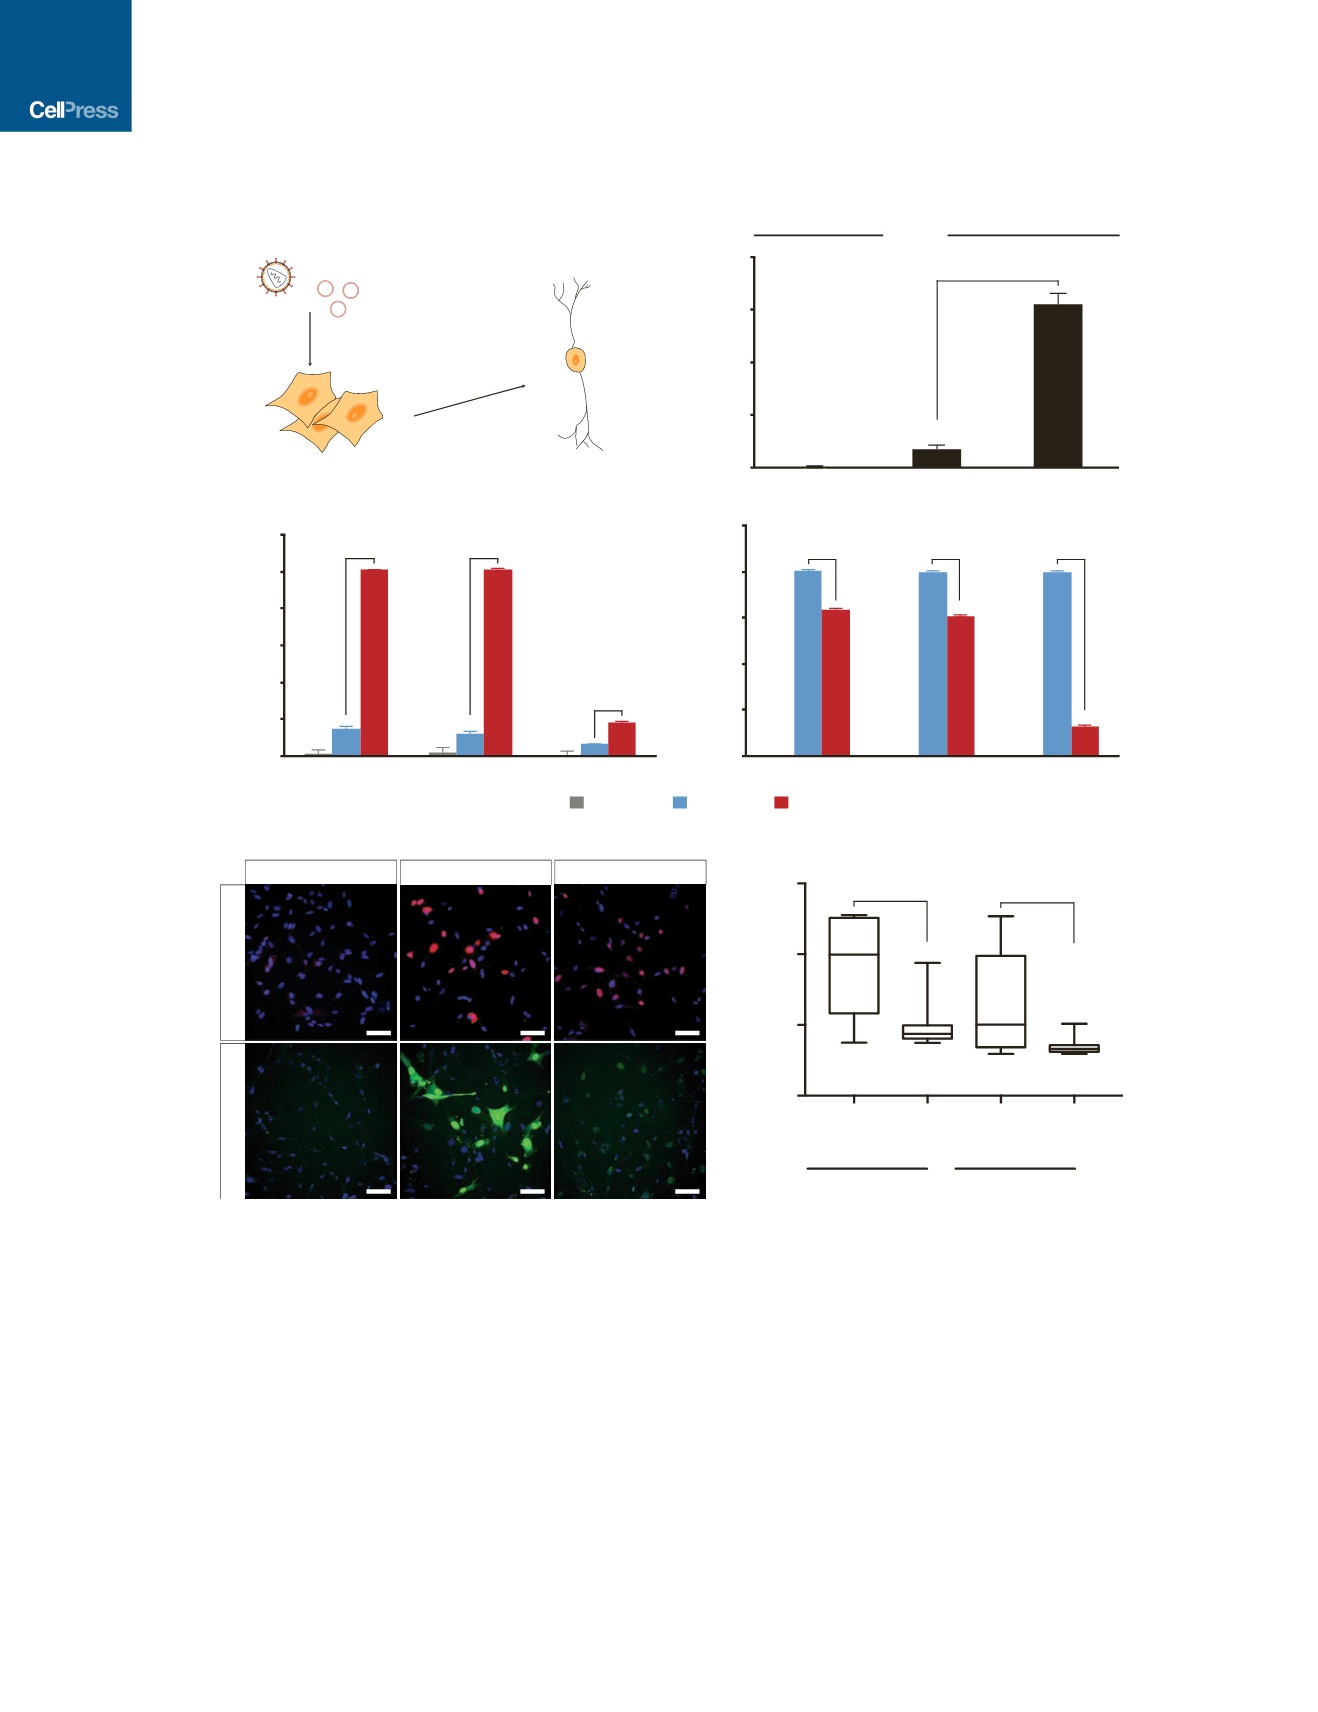
Figure 1. Endogenous Gene Activation of Neuronal Transcription Factors in PMEFs
(A) Reprogramming of PMEFs to neuronal cells via transduction of
VP64
dCas9
VP64
and transfection of gRNA expression plasmids targeting the endogenous BAM
factors.
(B) Transcriptional activation of
ASCL1
in HEK293T cells with dCas9
VP64
or
VP64
dCas9
VP64
(*p < 0.05).
(C and D) Endogenous expression (C) and total expression (D) of the BAM factors in PMEFs with targeted activation (CR-BAM) or ectopic overexpression (pBAM;
*p < 0.05).
(E) Immunofluorescence staining of Brn2 and Ascl1 in PMEFs demonstrated protein expression through targeted activation of the endogenous loci or expression
from ectopic plasmids (scale bar, 50
m
m).
(F) Automated image analysis of fluorescence intensity revealed significantly more single-cell Brn2 and Ascl1 protein with pBAM transfection compared to
CR-BAM (*p < 0.05 between distributions of single-cell mean fluorescence; Z-test).
All gRNAs used are listed in Table S1. All assays were performed on day 3 post-transfection. qRT-PCR data are presented as mean ± SEM for n = 3 biological
replicates. p values for qRT-PCR data were determined by global one-way ANOVA with Holm-Bonferroni post hoc tests (
a
= 0.05). See also Figure S1.
408
Cell Stem Cell
19
, 406–414, September 1, 2016