


 68 128

A
C
3’ LTR
VP64
dCas9
VP64
WPRE
hUbC
5’ LTR
3’ LTR
mU6 gRNA
H1
7SK
Coculture with glia
-60
25
50 ms
40 pA
20 pA
+ 1 μM TTX
0.2nA
mV
mV
5’ LTR
gRNA hU6
gRNA gRNA
B
WPRE
Tuj1
/
Map2
Tuj1
D
E
F
1 ms
0.25
5 ms
G
Fold Enrichment H3K27ac
dCas9
VP64
BAM gRNAs
+
VP64
Ascl1
Fold Change mRNA
Brn2
Ascl1
Myt1l
Endogenous Expression
0
4
8
12
16
20
+2436
+1720
+1348
+644
+130
-228
-863
-1250
Brn2
0
2
4
6
8
+2259
+1877
+1482
+1230
+507
+145
-314
0
2
4
6
-1821
-965
-665
+210
+255049
+261083
lentiBAM D3
lentiBAM D6
lentiCR-BAM D3
lentiCR-BAM D6
Myt1l
*
†
*
†
*
*
*
†
*
*
*
*
*
*
*
*
*
† *
†
*
†
*
*
*
*
*
† *
*
*
*
*
*
*
†
*
*
*
†
*
*
*
0.1
1
10
100
1000
10000
100000
lentiBAM D3
lentiBAM D6
lentiCR-BAM D3
lentiCR-BAM D6
*
†
*
*
†
*
†
*
†
*
*
*
*
†
*
†
0.1
1
10
100
NT
lentiBAM lentiCR-BAM
Tuj1 Map2 Cells (%DAPI)
+
+
*
10 mV
10 ms
-56
mV
nA
Tuj1
Syn-RFP
/
*
*
*
*
*
†
*
*
*
†
*
*
*
†
*
*
*
†
*
†
*
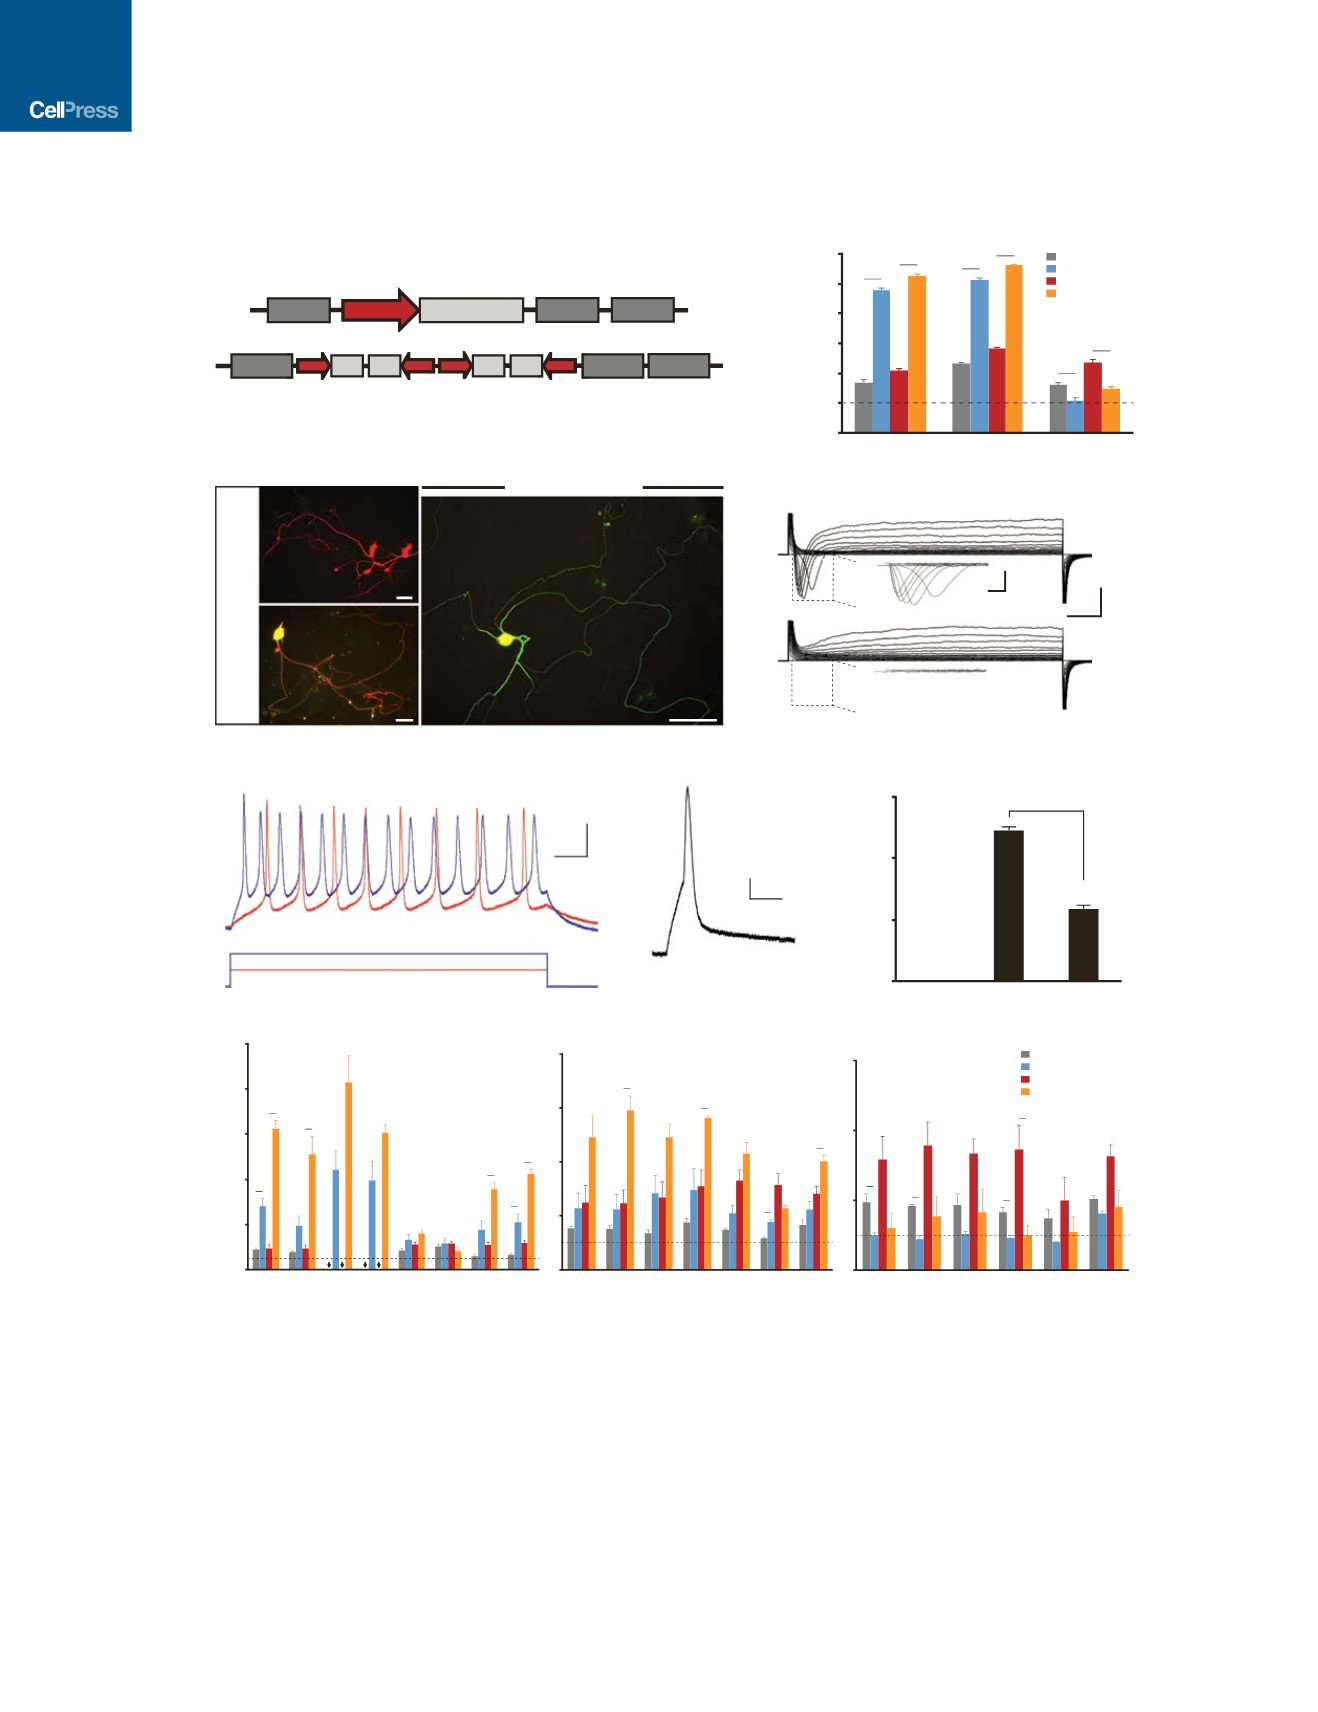
Figure 4. Generation of Functionally Mature iNs with Multiplex gRNA Vectors
(A) Schematic of
VP64
dCas9
VP64
and multiplex gRNA lentiviral constructs used to enable stable integration and constitutive expression.
(B) Relative mRNA expression of the endogenous BAM factors following transduction of transgenes encoding the BAM factors (lentiBAM) or
VP64
dCas9
VP64
and
gRNAs targeting the endogenous BAM factors (lentiCR-BAM; *p < 0.05 relative to non-treated PMEFs;
y
p < 0.05 between lentiBAM versus lentiCR-BAM
transduction).
(C) Immunofluorescence staining of PMEFs following transduction of lentiCR-BAM. Cells were co-positive for Tuj1 and Map2 and exhibited complex neuronal
morphologies (scale bar, 50
m
m).
(D) Action potentials were evoked from
VP64
dCas9
VP64
-induced neuronal cells in response to 5-ms (right) or 500-ms (left) step depolarizing current injection
(six out of seven cells analyzed) after empiric hyperpolarizing current injection to hold membrane potential at
60 mV.
(E) Representative whole-cell currents recorded with or without perfusion of 1
m
M tetrodotoxin (TTX).
(F) Quantitation of Tuj1
+
Map2
+
cells as percent nuclei (*p < 0.05 between lentiBAM versus lentiCR-BAM transduction; NT, non-treated PMEFs).
(G) Time course of H3K27ac enrichment along the
Brn2
,
Ascl1
, and
Mytl1
loci (*p < 0.05 relative to non-treated PMEFs;
y
p < 0.05 between lentiBAM versus
lentiCR-BAM transduction).
All p values calculated by global ANOVA with Holm-Bonferroni post hoc tests (
a
= 0.05).
412
Cell Stem Cell
19
, 406–414, September 1, 2016