


 67 128

MEF H3K4me3
E14.5 Brain H3K4me3
E14.5 Brain H3K27ac
MEF H3K27ac
Brn2
Brn2
(NCBI37/mm9)
chr4
(ENCODE)
Scale
0
15
0
30
chr10
(ENCODE)
Scale
Ascl1
Ascl1
(NCBI37/mm9)
MEF H3K4me3
E14.5 Brain H3K4me3
E14.5 Brain H3K27ac
MEF H3K27ac
A
B
C
D
Fold Enrichment
Fold Enrichment
0
15
0
30
ChIP-qPCR Targets
gRNAs
+2436
+1720 +1348
+644 +130 -228
-863 -1250
0
2
4
6
8
10
12
14
+2436 +1720 +1348
+644 +130 -228 -863
-1250
H3K27ac
*
*
*
*
*
*
*
*
0
5
10
15
20
25
30
H3K4me3
+2436 +1720 +1348
+644 +130 -228 -863
-1250
*
*
*
*
pLuc
pBAM
CR-BAM
ChIP-qPCR Targets
0
15
0
30
0
15
0
30
86,953,500
86,954,500
86,955,500
86,956,500
+2259
+1877
+1482 +1230
+507
+145
-314
gRNAs
0
2
4
6
8
10
12
H3K27ac
H3K4me3
pLuc
pBAM
CR-BAM
Fold Enrichment
Fold Enrichment
0
1
2
3
4
5
6
7
*
*
*
*
*
*
*
+2259 +1877 +1482
+1230 +507 +145
-314
+2259 +1877 +1482
+1230 +507 +145
-314
*
*
*
*
2 kb
2 kb
22,409,500 22,410,500 22,411,500 22,412,500 22,413,500 22,414,500 22,415,500
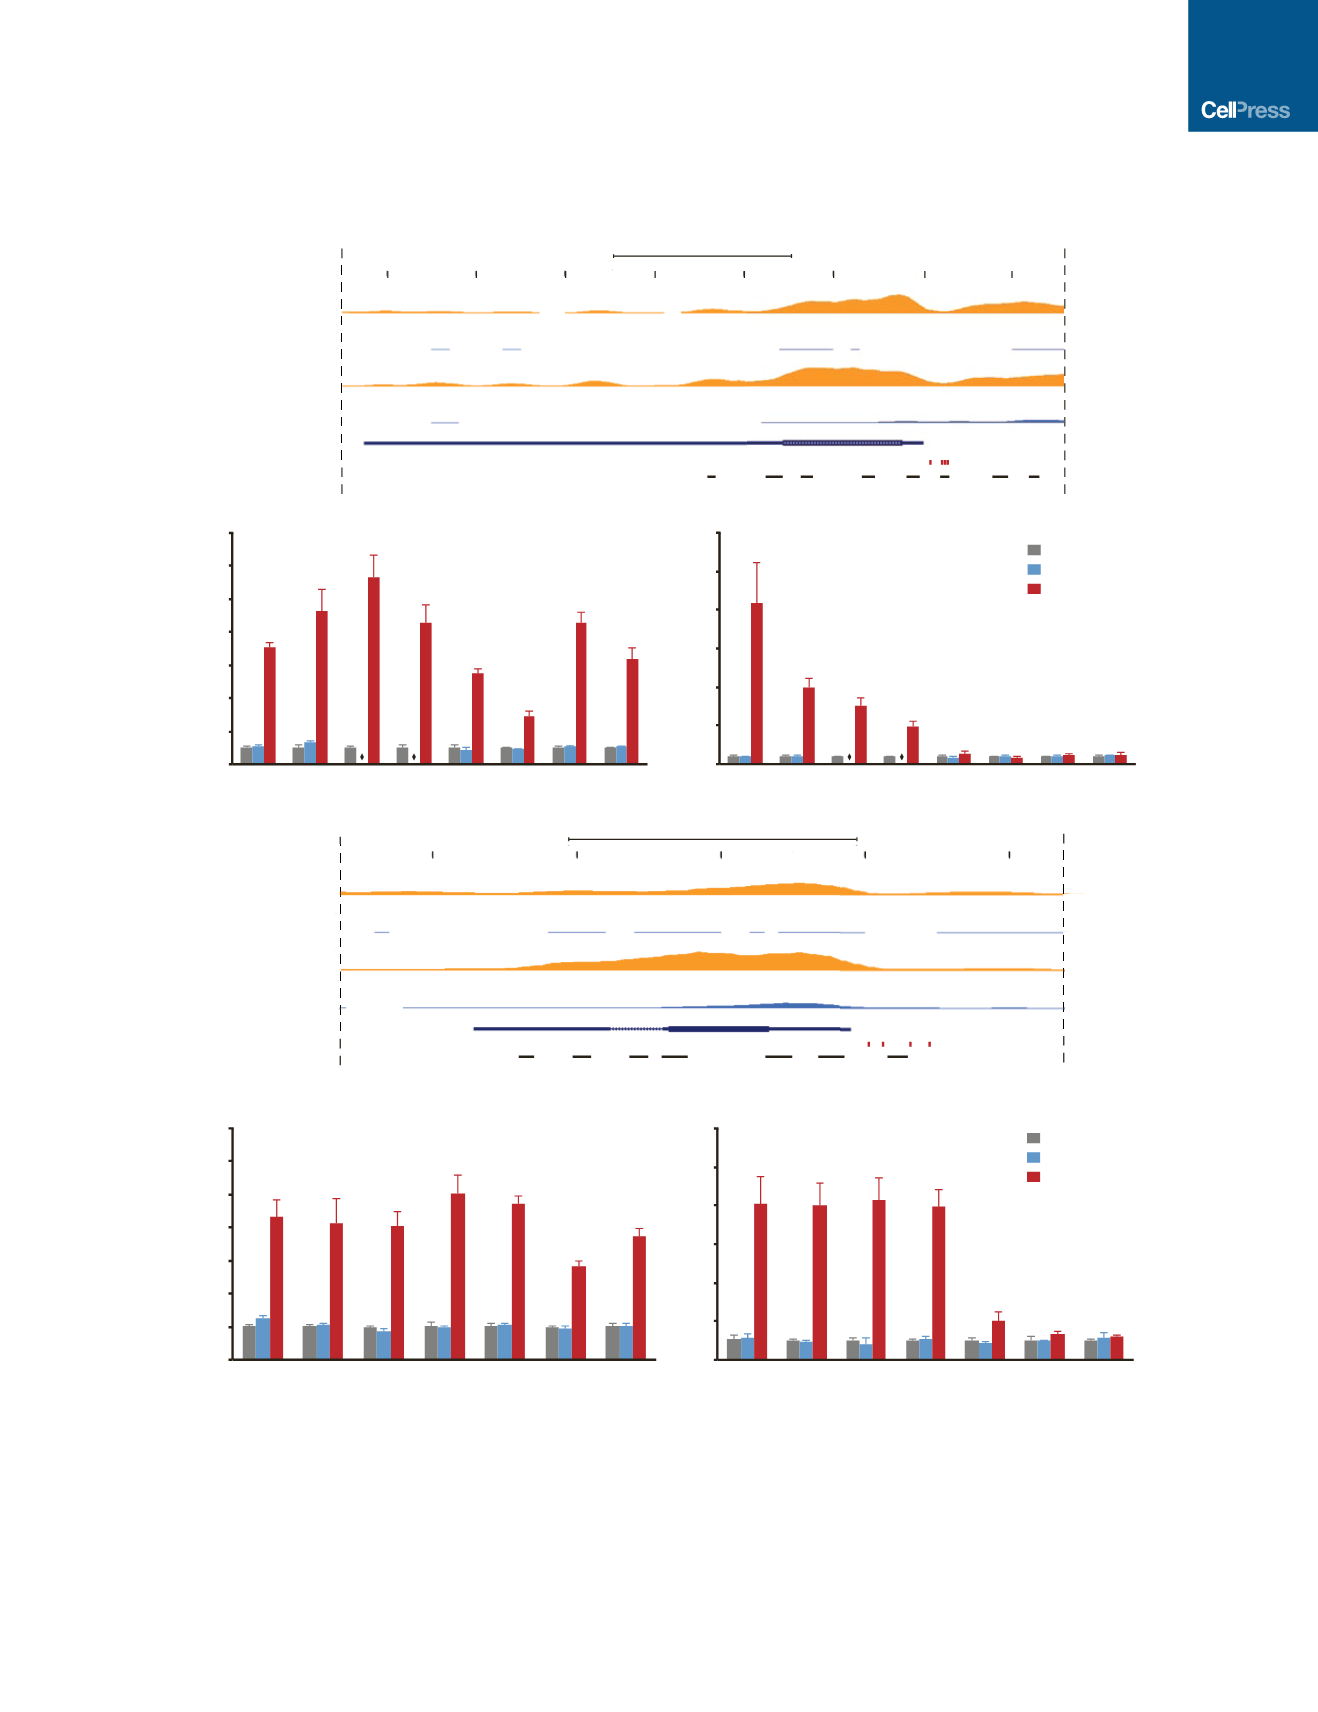
Figure 3.
VP64
dCas9
VP64
Rapidly Remodels Epigenetic Marks at Target Loci
(A and C) Mouse genomic tracks depicting histone H3 modifications H3K27ac and H3K4me3 at the
Brn2
and
Ascl1
loci in embryonic brain tissue and fibroblasts
(data from Mouse ENCODE; GEO: GSE31039). Red bars indicate gRNA target sites near the transcription start site, and black bars indicate the location of
ChIP-qPCR amplicons along the gene locus.
(B and D) Targeted activation of endogenous
Brn2
and
Ascl1
in PMEFs induced significant enrichment of H3K27ac and H3K4me3 at multiple sites along the
genomic loci at day 3 post-transfection (*p < 0.05, one-way ANOVA with Holm-Bonferroni post hoc tests, n = 3 biological replicates). Overexpression of the BAM
factors via transfection of expression plasmids encoding BAM factor transgenes did not induce a significant change in these chromatin marks. qPCR primers
targeting coding regions of the genes are not included for the pBAM transfection condition, as contaminating plasmid DNA biased enrichment values, and are
marked with diamonds in (B). All fold enrichments are relative to transfection of a plasmid encoding firefly luciferase and normalized to a region of the
Gapdh
locus.
See also Figure S3 and S4.
Cell Stem Cell
19
, 406–414, September 1, 2016
411