


 65 128

(Figure S2A), but these cells were never reactive to the Map2
antibody. Consistent with previous studies, direct overexpres-
sion of the ectopic BAM factors via transfection of constitutive
expression plasmids generated Tuj1
+
Map2
+
cells with neuronal
morphologies (Figure S2B) (Adler et al., 2012; Vierbuchen
et al., 2010).
Image analysis revealed that CR-BAM transfection generated
a modest, but statistically significant and reproducible, increase
in the number of Tuj1
+
cells compared to pBAM transfection after
14 days in culture post-transfection (Figure 2D), despite much
lower overall expression of the BAM factors (Figures 1D–1F).
There was no difference in the percentage of Tuj1
+
cells that
also expressed Map2 (Figure 2E). To evaluate the contribution
of each neurogenic factor to the generation of Tuj1
+
cells and
to the level of neuronal maturation, we transfected gRNAs target-
ing different combinations of the endogenous factors. Removal
of gRNAs targeting the
Brn2
locus attenuated iN production
5-fold when compared to that generated with targeted activa-
tion of all three endogenous factors (Figure 2F). We detected a
slight reduction in Tuj1
+
cell production with the removal of
Myt1l
gRNAs (Figure 2F). Neuronal maturity was assessed as
the percentage of Tuj1
+
cells co-positive for the Syn-RFP re-
porter. Removal of
Brn2
gRNAs reduced the percentage of
RFP
+
cells >2-fold, but no change was detected with removal
of
Myt1l
gRNAs (Figure 2F). pBAM transfection generated a
higher percentage of RFP
+
cells than CR-BAM transfection,
though it was not statistically significant (Figure 2F).
Induction of Endogenous Gene Expression Is Rapid and
Sustained
For any reprogramming strategy, activation of the endogenous
genes encoding the master fate-specifying transcription factors
is an important step to the successful reprogramming and stabil-
ity of the new cellular phenotype (Vierbuchen and Wernig, 2011).
Consequently, we compared the kinetics of endogenous gene
expression through late stages of reprogramming with pBAM
or CR-BAM transfection. We observed activation of all three
endogenous genes as early as 1 day post-transfection with
CR-BAM that remained at high levels through day 18 in
culture (Figure S3A). Expression of the BAM factors from
the endogenous loci was significantly higher with targeted acti-
vation via CR-BAM compared to ectopic overexpression via
pBAM transfection throughout the time course of the experi-
ment. Activation of the endogenous genes by pBAM transfec-
tion was delayed, and a significant and sustained increase
over baseline levels was only detected for endogenous
Ascl1
and
Myt1l
(Figure S3A).
We next assessed the kinetics of expression of the down-
stream pan-neuronal marker
Tuj1
. Both pBAM and CR-BAM
treatment generated a significant increase in
Tuj1
expression
throughout the time course of the experiment (Figure S3B).
At early time points,
Tuj1
levels were higher with pBAM treat-
ment than CR-BAM. However,
Tuj1
levels with pBAM treat-
ment peaked 7 days post-transfection and declined thereafter,
whereas expression following CR-BAM treatment remained
B
A
Timeline to assay neuronal phenotypes
Transduce
VP64
dCas9
VP64
hSyn-RFP
Day
Transfect gRNA
cocktail
- 4
0
3
qRT-PCR
ChIP-qPCR
10
Remove small
molecules (SM)
from medium
14 - 20
IF
PMEF
N3 w/SM
N3
1
Medium
C
Tuj1
Tuj1/DAPI
Map2
Tuj1
/
Syn-RFP
Tuj1
/
Map2
)iii(
)ii(
)i(
)v(
)vi(
Fold Change mRNA
Tuj1
*
*
Tuj1 Cells (% DAPI)
+
pLuc pBAM CR-BAM
0
1
2
3
4
*
n.s.
Map2 Cells (% Tuj1 )
+
+
pLuc pBAM CR-BAM
0
20
40
60
80
a
b
c
d
Normalized Tuj1 Cells
+
0
0.2
0.4
0.6
0.8
1.0
1.2
I
a a
c
Syn-RFP Cells (% Tuj1 )
+
+
II III IV V VI
I
II
III IV V VI
I:CR-BAM II:CR-BA III:CR-AM IV:CR-A V:pBAM VI:pLuc
D
0
20
40
60
E F
c
e
a
0
1
2
3
4
5
6
pLuc
pBAM
CR-BAM
dCas9
VP64
BAM gRNAs
+
VP64
b b,c
p=0.07
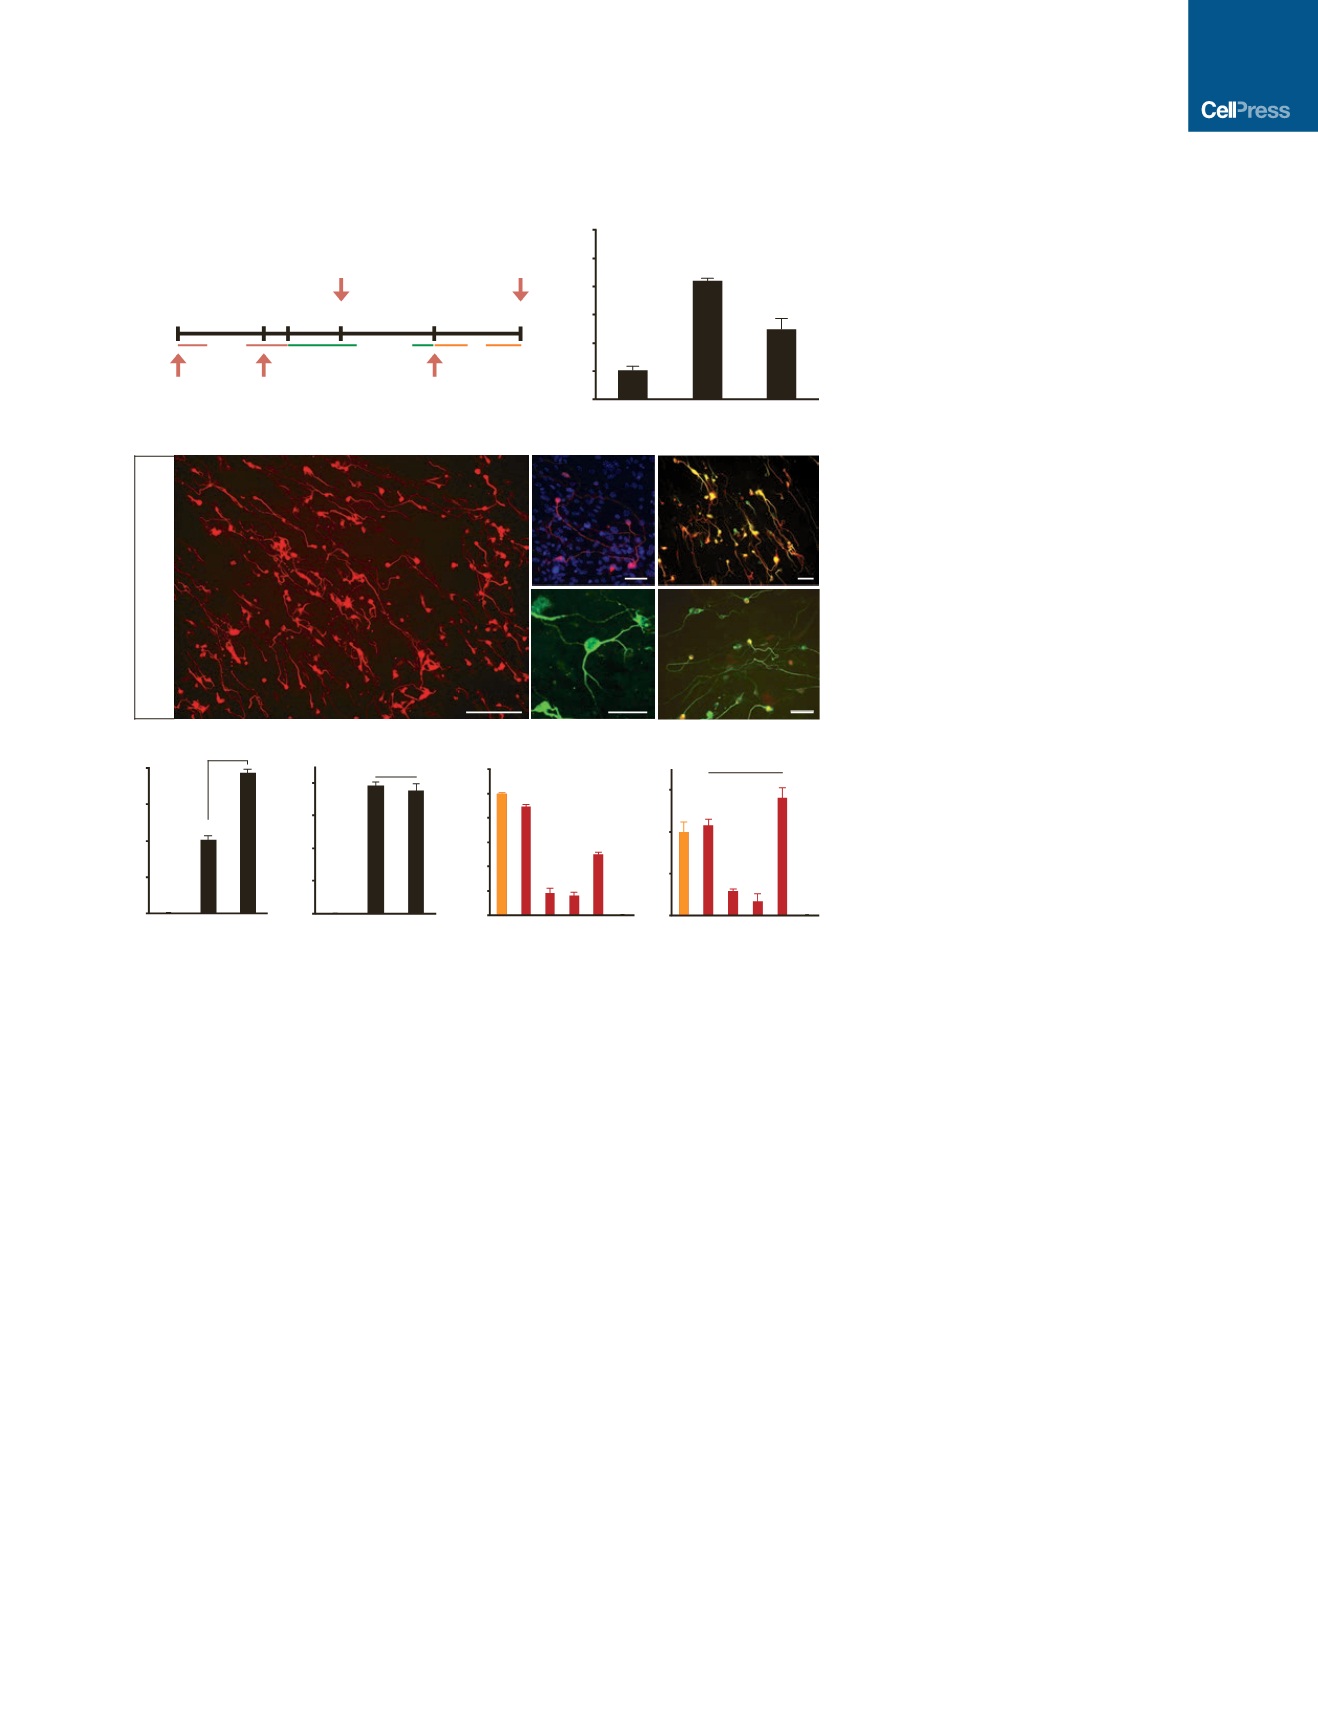
Figure 2. Induction of Neuronal Cells from
PMEFs via
VP64
dCas9
VP64
-Mediated Gene
Activation
(A) PMEFs were transduced with a lentivirus
encoding the
VP64
dCas9
VP64
transactivator and
subsequently transfected with gRNAs targeting
Brn2
,
Ascl1
, and
Myt1l
. Neuronal phenotypes were
assayed as indicated.
(B) Transcriptional activation of
Tuj1
was detected
in PMEFs at day 3 post-transfection of pBAM
or CR-BAM (*p < 0.05 relative to transfection of a
plasmid encoding firefly luciferase [pLuc]).
(C)
Immunofluorescence staining revealed
numerous Tuj1
+
cells with neuronal morphologies
co-expressing Map2 at day 14 post-transfection of
CR-BAM. The cells with the most elaborate
neuronal morphologies activated the synapsin
promoter in a Syn-RFP lentiviral reporter (scale
bars, 100
m
m [i], 50
m
m [ii–v]).
(D) Quantitation of Tuj1
+
cells as percent nuclei
at day 14 post-transfection of pLuc, pBAM, or
CR-BAM (*p < 0.05).
(E) Quantitation of Map2
+
cells as percent Tuj1
+
cells at day 14 post-transfection of pLuc, pBAM, or
CR-BAM (n.s., not significant).
(F) Quantitation of Tuj1
+
and RFP
+
cells with
transfection of different combinations of gRNAs.
Tuj1
+
cells are normalized to CR-BAM trans-
fection. Conditions that share the same letter (a–e)
are not significantly different.
p values were determined by global one-way
ANOVA with Holm-Bonferroni post hoc tests (
a
=
0.05). See also Figure S2.
Cell Stem Cell
19
, 406–414, September 1, 2016
409