


 76 128

A
B
C
D
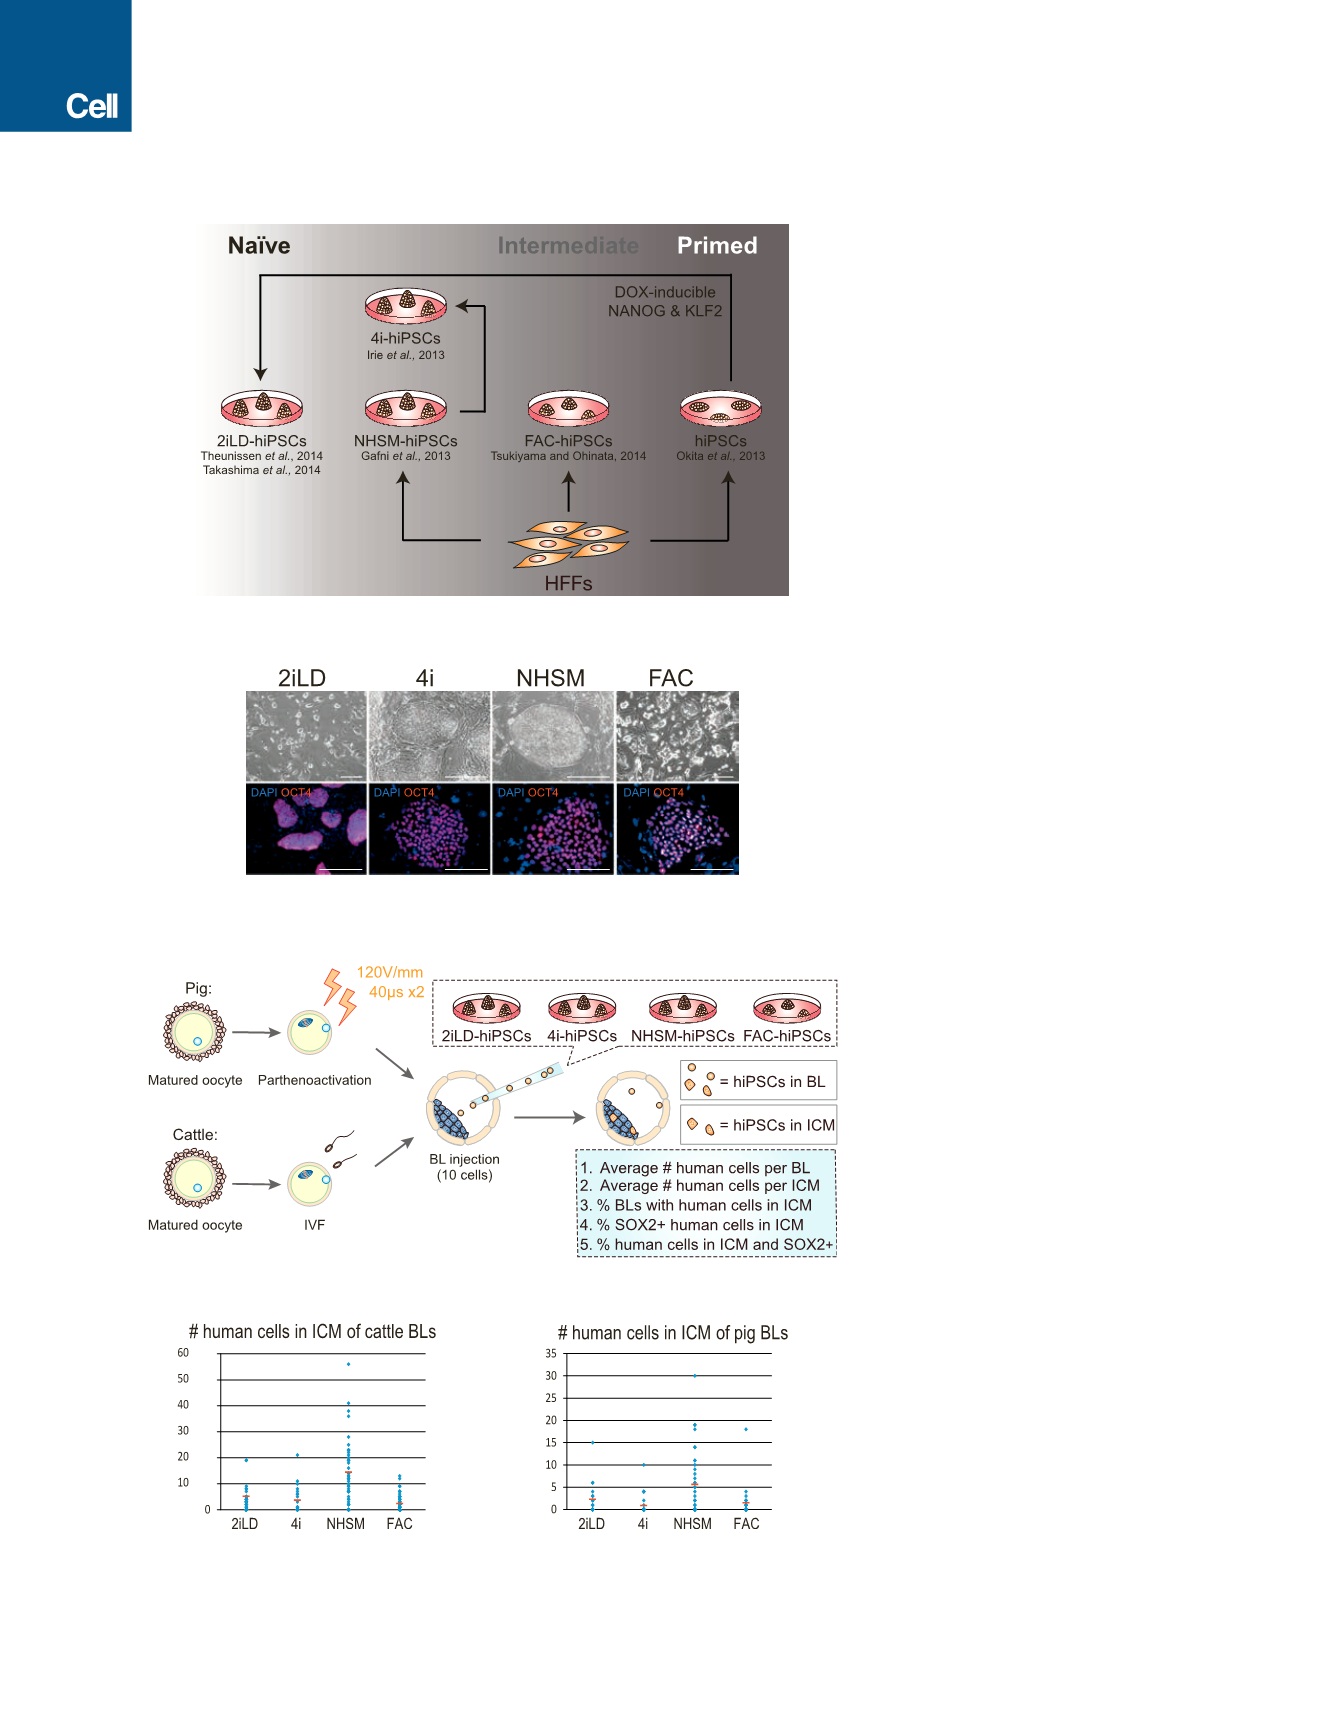
Figure 4. Generation and Interspecies ICM
Incorporation of Different Types of hiPSCs
(A) Schematic of the strategy for generating naive,
intermediate, and primed hiPSCs.
(B) (Top) Representative bright-field images
showing the colony morphologies of naive (2iLD-,
4i-, and NHSM-hiPSCs) and intermediate (FAC-
hiPSCs) hiPSCs. Bottom, representative immu-
nofluorescence images of naive and intermediate
hiPSCs stained with an anti-OCT4 antibody. Red,
OCT4; blue, DAPI. Scale bar, 100
m
m.
(C) Schematic of the experimental procedures for
producing cattle and pig blastocysts obtained
from in vitro fertilization (IVF) and parthenoactiva-
tion, respectively. Blastocysts were subsequently
used for laser-assisted blastocyst injection of
hiPSCs. After hiPSC injection, blastocysts were
cultured in vitro for 2 days before fixation and
analyzed by immunostaining with an anti-HuNu
and an anti-SOX2 antibodies. Criteria to evaluate
the survival of human cells, as well as the degree
and efficiency of ICM incorporation are shown in
the blue box.
(D) Number of hiPSCs that integrated into the
cattle (left) and pig (right) ICMs after ten hiPSCs
were injected into the blastocyst followed by
2 days of in vitro culture. Red line, the average
number of ICM-incorporated hiPSCs. Blue dot,
the number of ICM-incorporated hiPSCs in each
blastocyst.
See also Figure S3 and Table S4.
478
Cell
168
, 473–486, January 26, 2017