


 79 128

Rat-mouse chimeras generated by injecting donor rat PSCs into
a mouse host were mouse-sized and developed into adulthood
with apparently normal appearance and physiology. We further
show in this study that a rat-mouse chimera could live a full
mouse lifespan (about 2 years) and exhibit molecular signatures
characteristic of aged cells. This demonstrates that cells from
two different species, which diverged 18 million years ago,
can live in a symbiotic environment and are able to support
normal organismal aging. The fact that rat PSCs were able to
contribute to the mouse gallbladder, an organ that is absent in
the rat, highlights the importance of embryonic niches in orches-
trating the specification, proliferation, and morphogenesis of
tissues and organs during organismal development and evolu-
tionary speciation (Izpisu´ a-Belmonte et al., 1992).
Previous interspecies blastocyst complementation experi-
ments generated host embryos by crossing heterozygous
mutant mouse strains, which were themselves generated
through targeted gene disruption in germline competent ESCs.
A
B
C
D
E
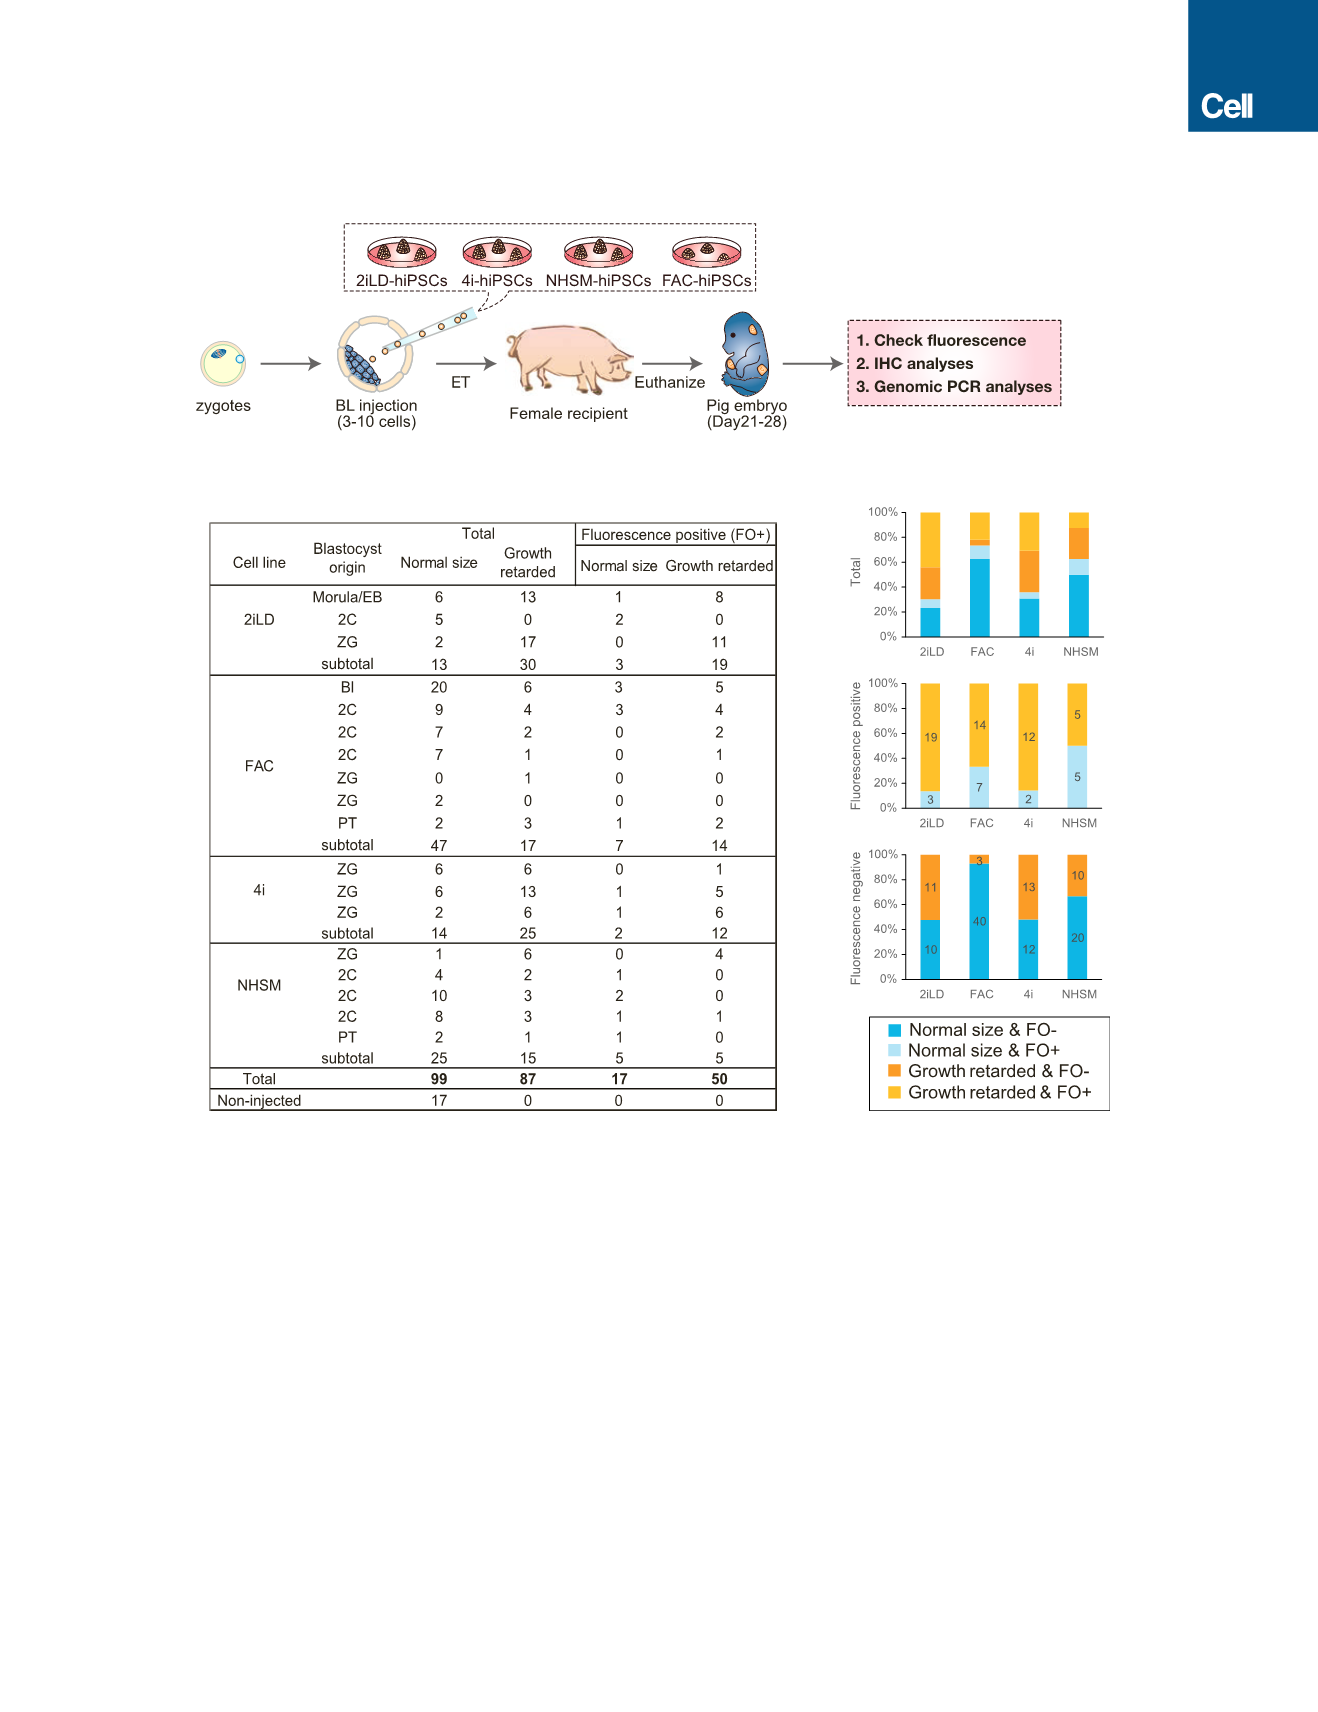
Figure 5. Generation of Post-implantation Human-Pig Chimeric Embryos
(A) Schematic of the experimental procedures for the generation and analyses of post-implantation pig embryos derived from blastocyst injection of naive and
intermediate hiPSCs.
(B) Summary of the pig embryos recovered between day 21–28 of pregnancy.
(C) Bar graph showing proportions of normal size and growth retarded embryos, as well as the proportion of fluorescence-positive and -negative embryos,
generated from different types of hiPSCs.
(D) Bar graph showing the proportion of normal size and growth-retarded embryos (among those exhibiting a fluorescence signal) generated from different types
of hiPSCs.
(E) Bar graph showing the proportion of normal-sized and growth-retarded embryos (among those without exhibiting a fluorescence signal) generated from
different types of hiPSCs.
See also Figure S4 and Tables S5 and S6.
Cell
168
, 473–486, January 26, 2017
481